1 The Experiment
1.1 A hypothesis
Our driving assumption is that the prophylactic application of antimicrobials on a farm will provide a local selection pressure that favours acquisition and retention of antimicrobial resistance.
This leads us to expect that, if we were to sample the bacterial communities from each farm, the proportion of antimicrobial-resistant bacteria would be higher for the farm where antimicrobials are used. So we need an experiment that allows us to measure (or estimate) the proportion of antimicrobial bacteria in a bacterial community, so we can test the following hypothesis:
We hypothesise that, given bacterial communities sampled from farms A (no antibiotic use) and B (prophylactic antimicrobial use), the proportion of antimicrobial-resistant bacteria will be greater in the communities from farm B.
In (bio)statistics we might express a hypothesis like the one above in a formal manner as a null hypothesis \(H_0\) (which we seek to reject), and an alternative hypothesis \(H_1\) (which states the interpretation if we can’t reject the null hypothesis). It is unusual to see this presentation in biological papers, but it can be useful to keep this in mind for the analysis:
- \(H_0\) (null hypothesis): There is either (i) no difference between the proportions of antimicrobial-resistant bacteria in samples from farms A (no antibiotic use) and B (antimicrobial use), or (ii) the samples from farm A have a higher proportion of antimicrobial-resistant bacteria.
- \(H_1\) (null hypothesis): The samples from farm B have a higher proportion of antimicrobial-resistant bacteria.
1.2 The experiment
To calculate the proprtion of antimicrobial bacteria in a sample, you will grow serial dilutions of a sample on two kinds of agar plate:
- nutrient agar (NA), which can support the growth of a wide range of bacteria
- nutrient agar supplemented with an antibiotic such as Ampicillin (NA/Amp), which will only support the subset of bacteria that can (i) grow on NA medium and (ii) tolerate the presence of the antibiotic
This should result in higher levels of growth on the NA plate than on the NA/Amp plate, for the same sample.
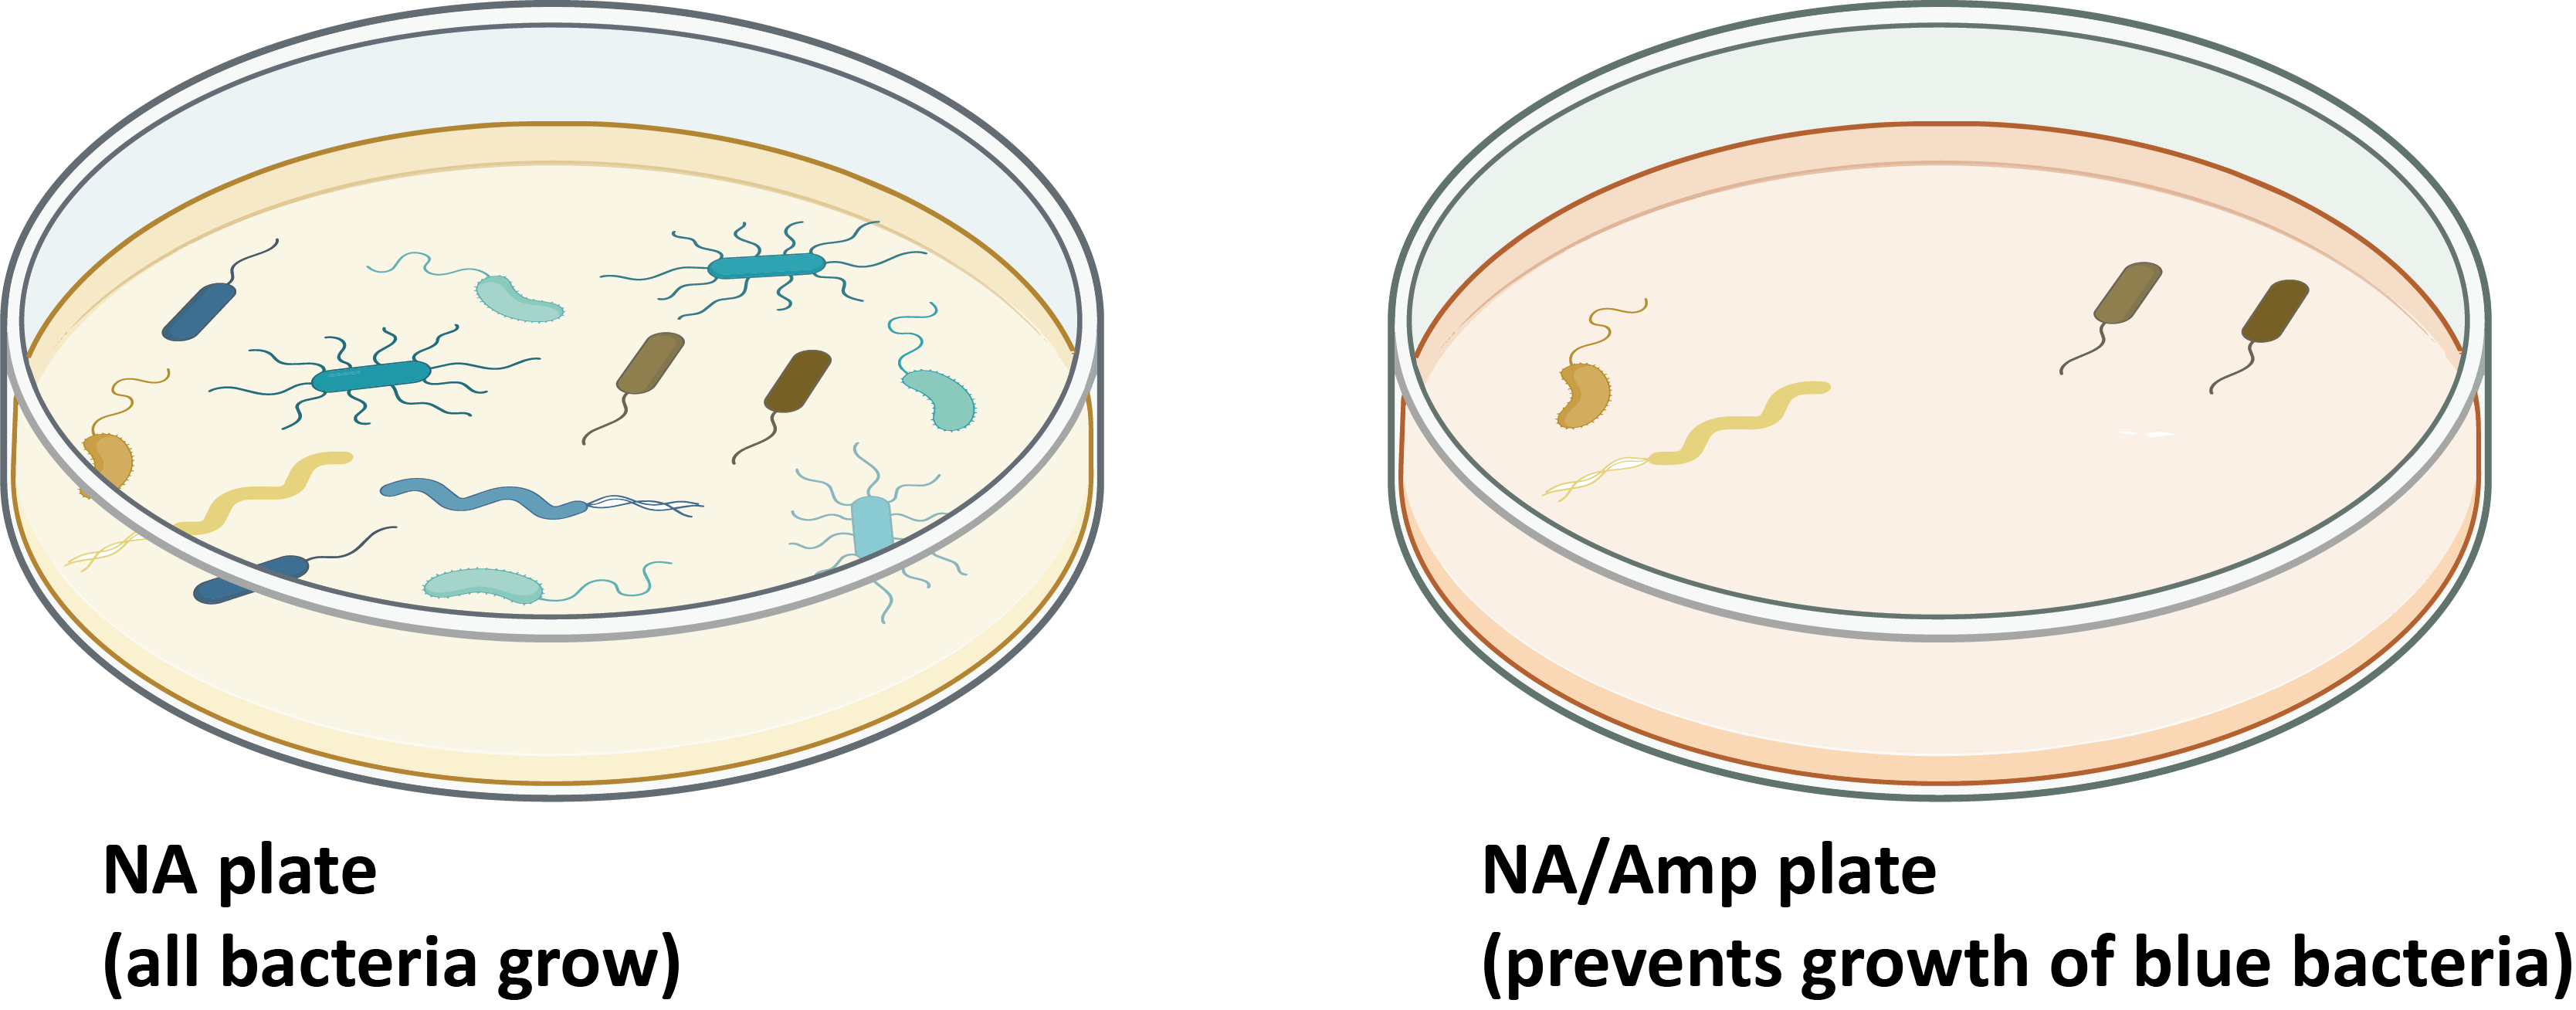
In Figure 1.1 the NA plate supports the growth of 13 bacterial colonies, while the NA/Amp plate only supports the growth of four colonies. The proportion of antimicrobial-resistant bacteria in that example is then estimated as \(4/13 = 0.31 = 31%\).