2 Diversity Measures
This section introduces the concept of a diversity measure in microbial ecology.
- We introduce an example community, obtained from Mars, to explore concepts with.
- We discuss fundamental concepts in ecological diversity:
- richness
- evenness
2.1 What is diversity?
Diversity measurements for a microbial community are quantitative estimates of how heterogeneous or homogeneous that community is. Qualitative estimates of diversity can be simple. If a community is composed of identical individuals, it is clearly not diverse. However, if the members of a community differ from each other at all, the community is diverse to some extent.
Diversity (or the lack of it) is a property of the community, not a property of individuals in the community.
If we want to record the level of diversity in a community, or compare it to other communities, we cannot easily rely on qualitative estimates. We need to be more precise than this, and to use quantitative approaches. We need to know what groups are present in the community and, numerically, to what extent each group is represented.
2.1.1 An example community
To help illustrate this, we went to Mars1 to obtain a sample (Figure 2.1).
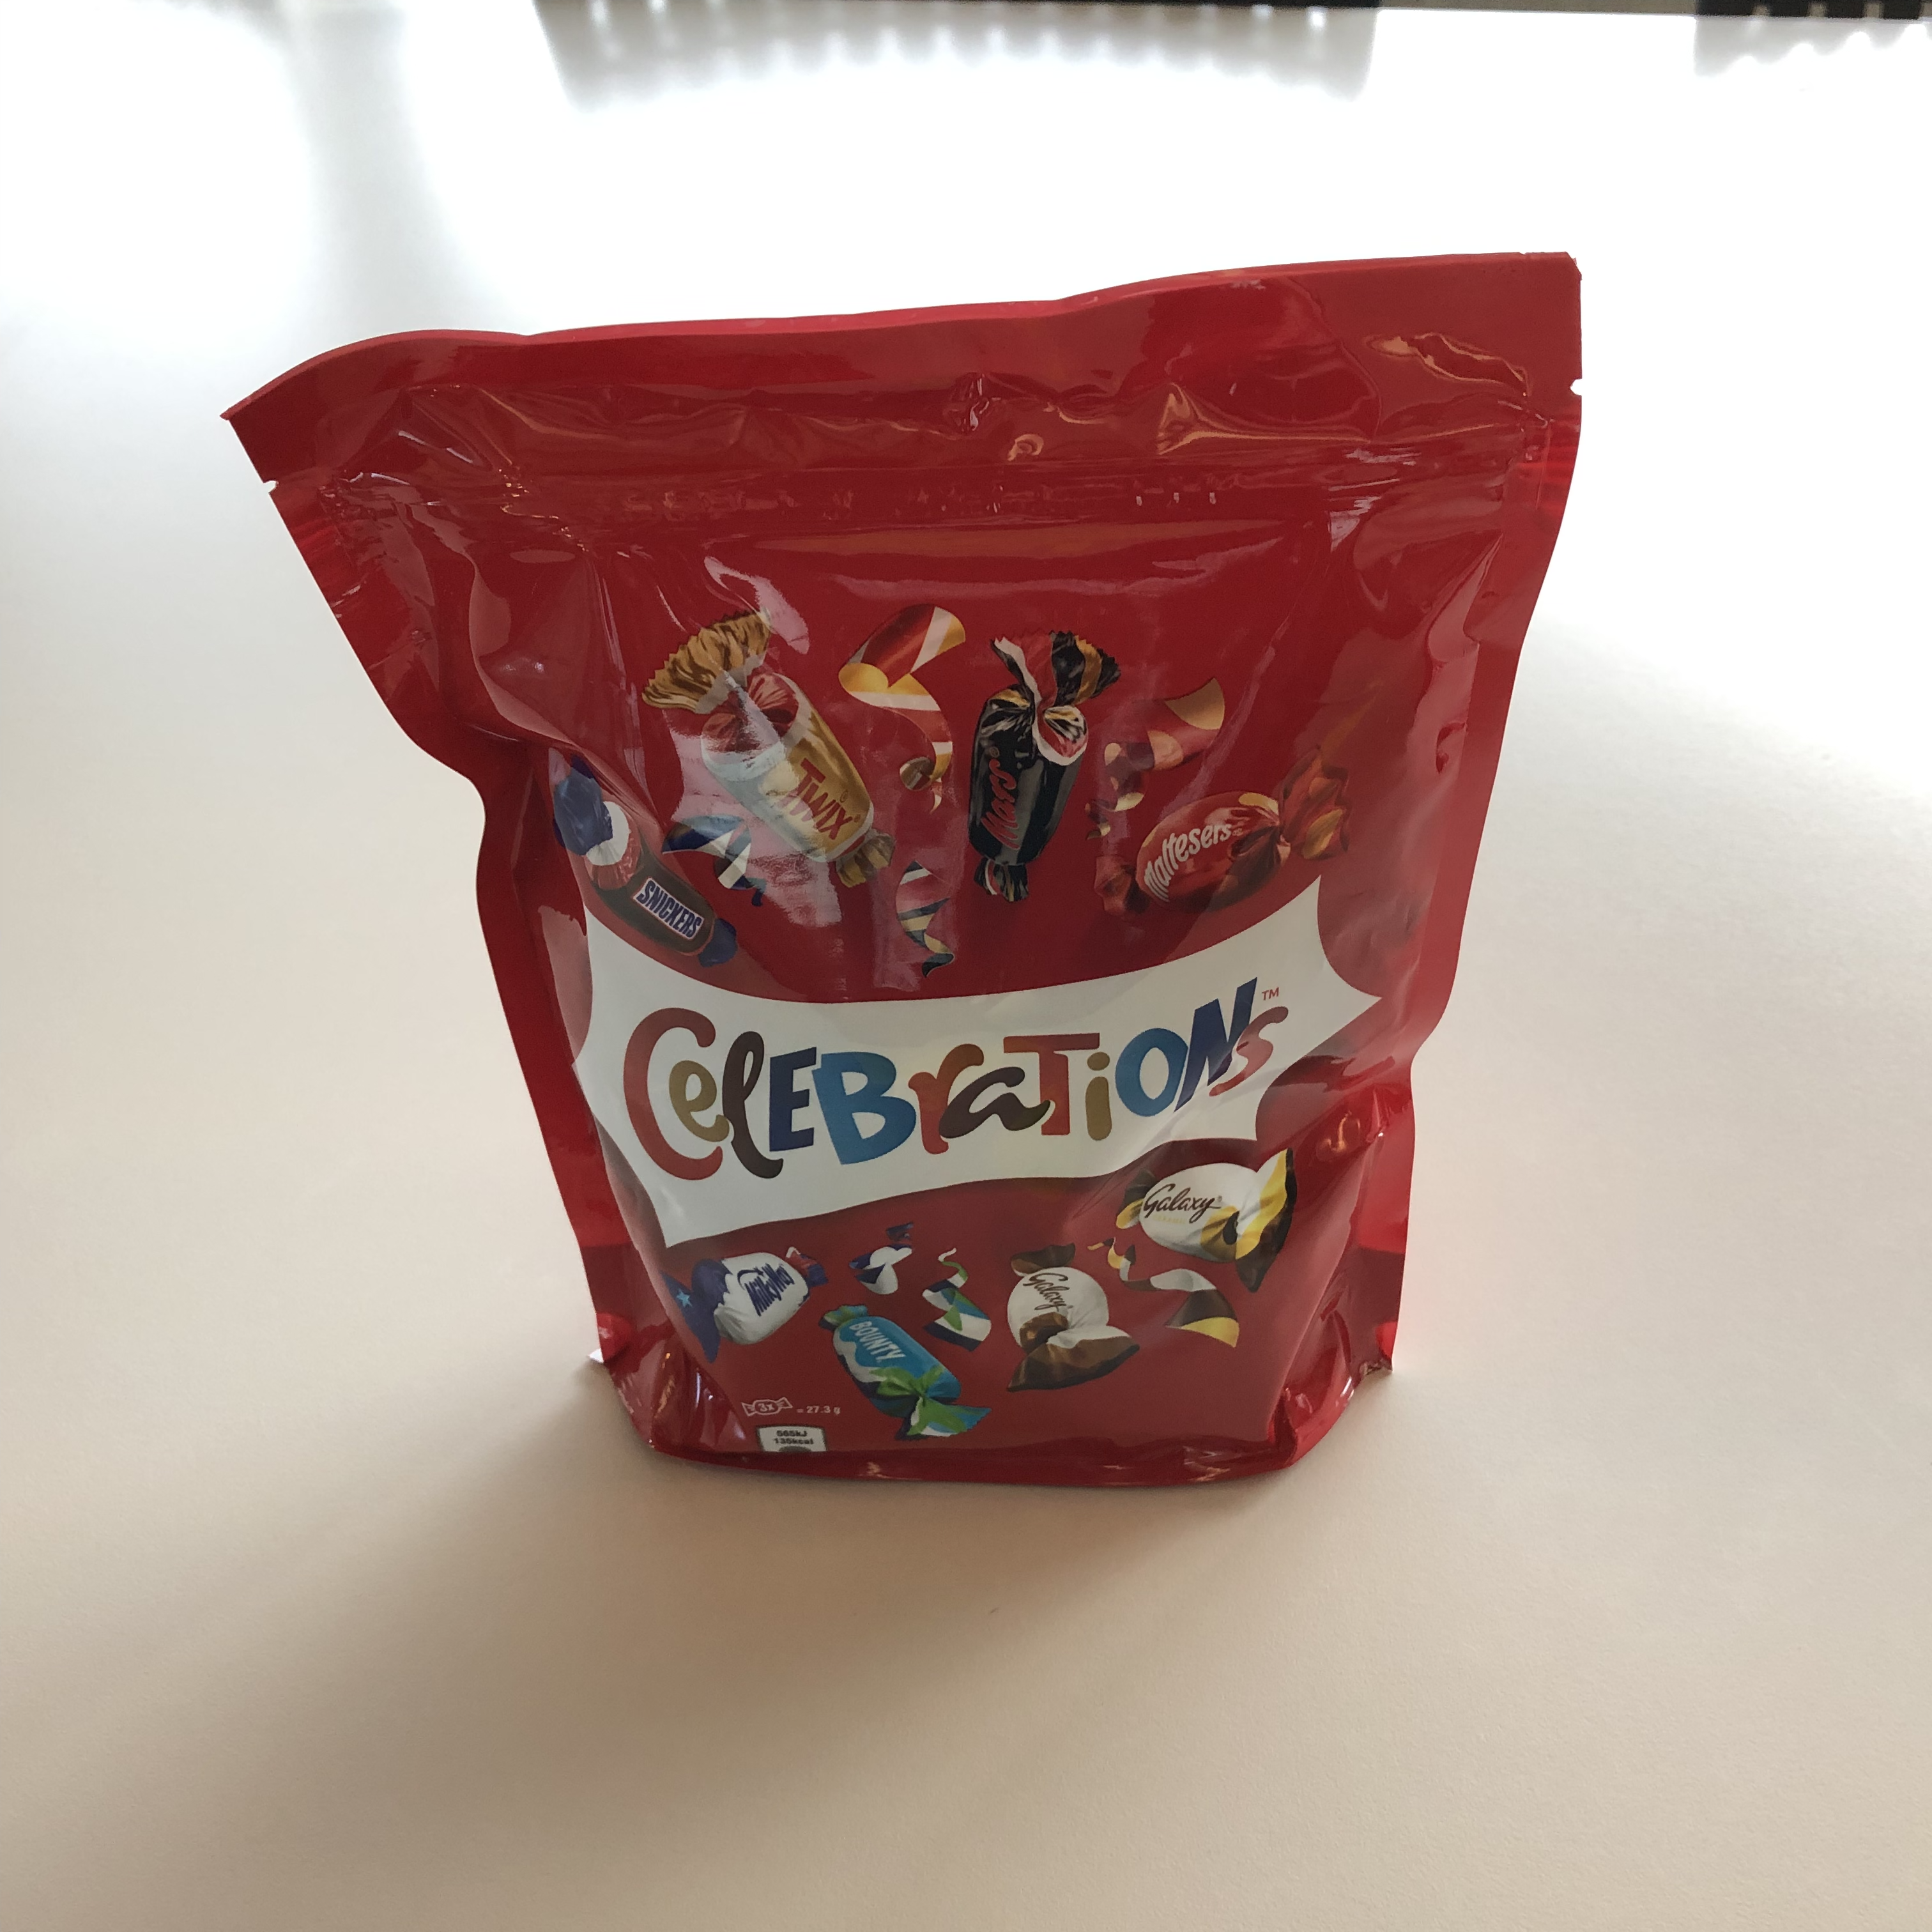
This community contains a range of individuals of different type, distinguishable by the detailed structure of their outer membranes, and also by their internal contents. The diversity of the community can be seen in (Figure 2.2).
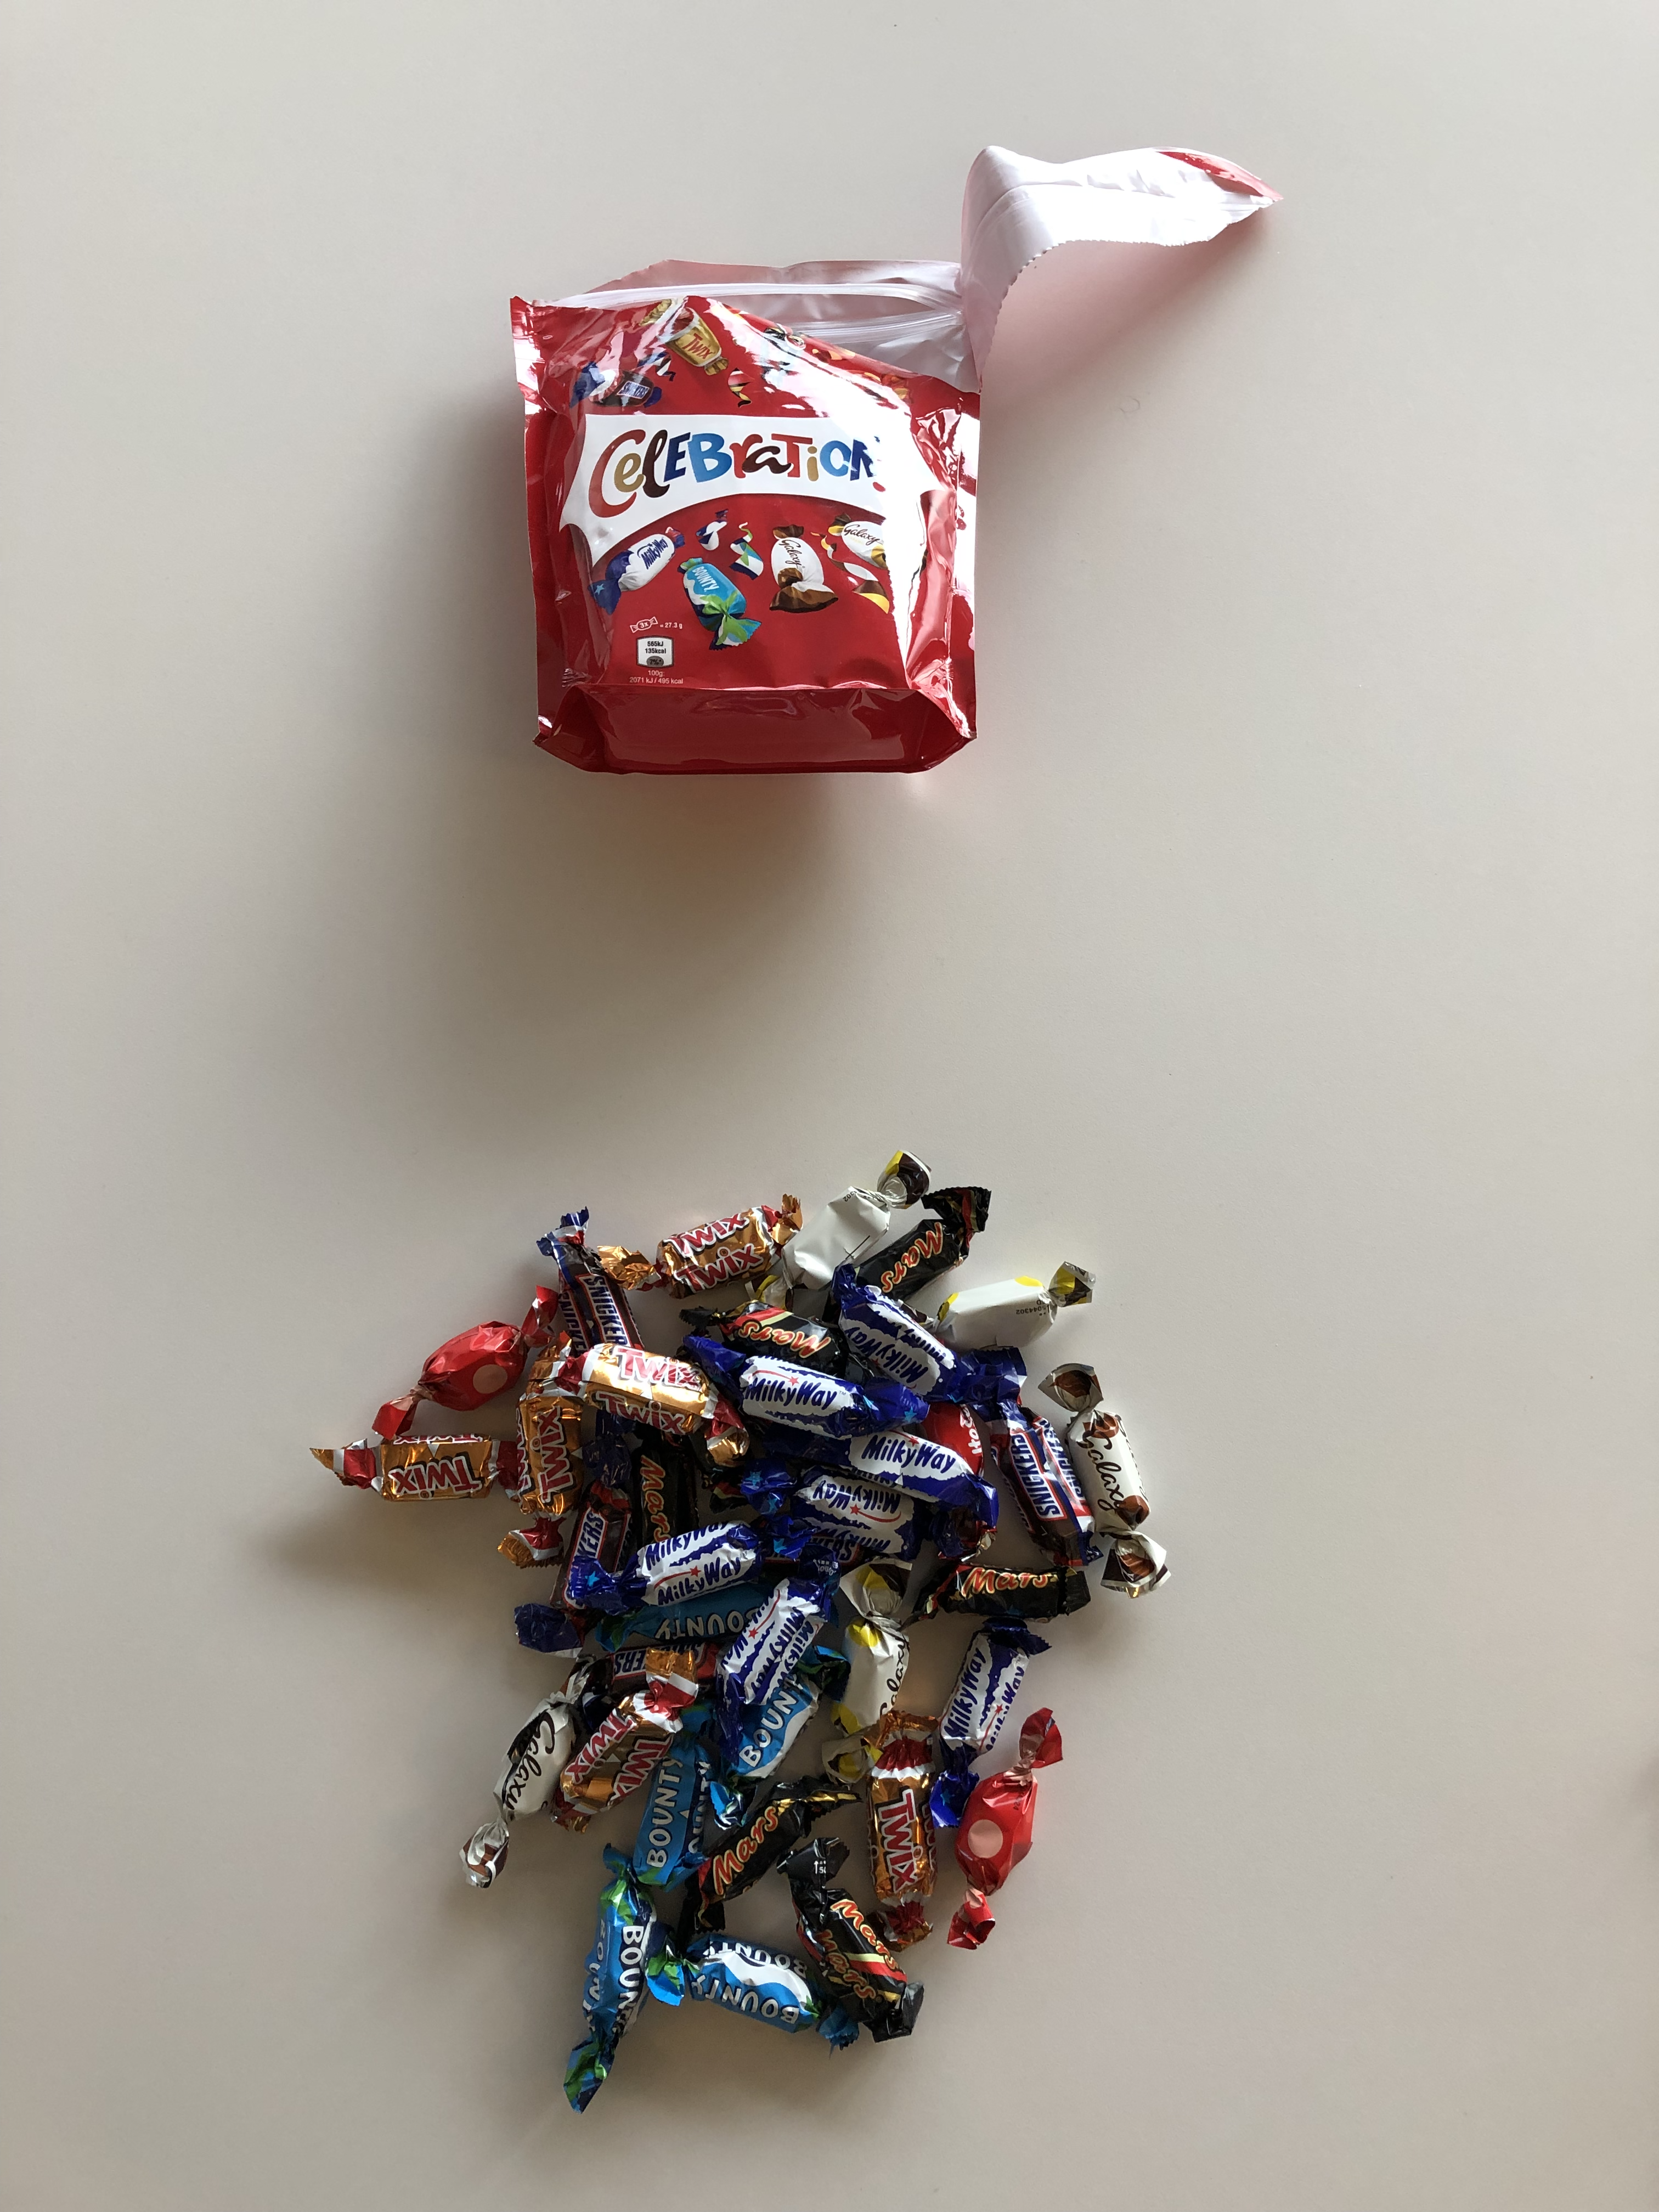
By visual inspection of Figure 2.2, how diverse would you say the sample is?
(click to expand the answer)
There are clearly several different kinds of individual present, so the sample is not homogenous and is diverse in some sense. But in another sense the individuals are all individually-wrapped sweets, so the sample is entirely homogeneous.
We clearly need to be more precise about what exactly we mean, when talking about diversity, so that others can understand exactly what we mean. Diverse in what measure, as well as to what extent.
2.2 Community richness and evenness
We usually define how diverse a community is by using a diversity index. This is a number that reflects the distribution of different types (such as microbial species) of individual that are found in a sample. There are two major concepts that contribute to diversity indices.
The richness of a sample is the number of different types that are represented in the sample.
For example, species richness is a count of the total number of species in the sample. It does not take into account species abundance, or relative abundance.
The evenness of a sample reflects how similar is the abundance of each type of thing in the sample. The more similar the proportion of each type, the more even the community.
For example, species evenness reflects the relative abundances of distinct species in the sample. If a sample contains three species: \(A\), \(B\), and \(C\), then:
- a sample with 33% \(A\), 33% \(B\), and 33% \(C\) has high species evenness
- a sample with 5% \(A\), 90% \(B\), and 5% \(C\) has low species evenness
But both samples are equally rich.
2.3 Richness and evenness in the Mars sample
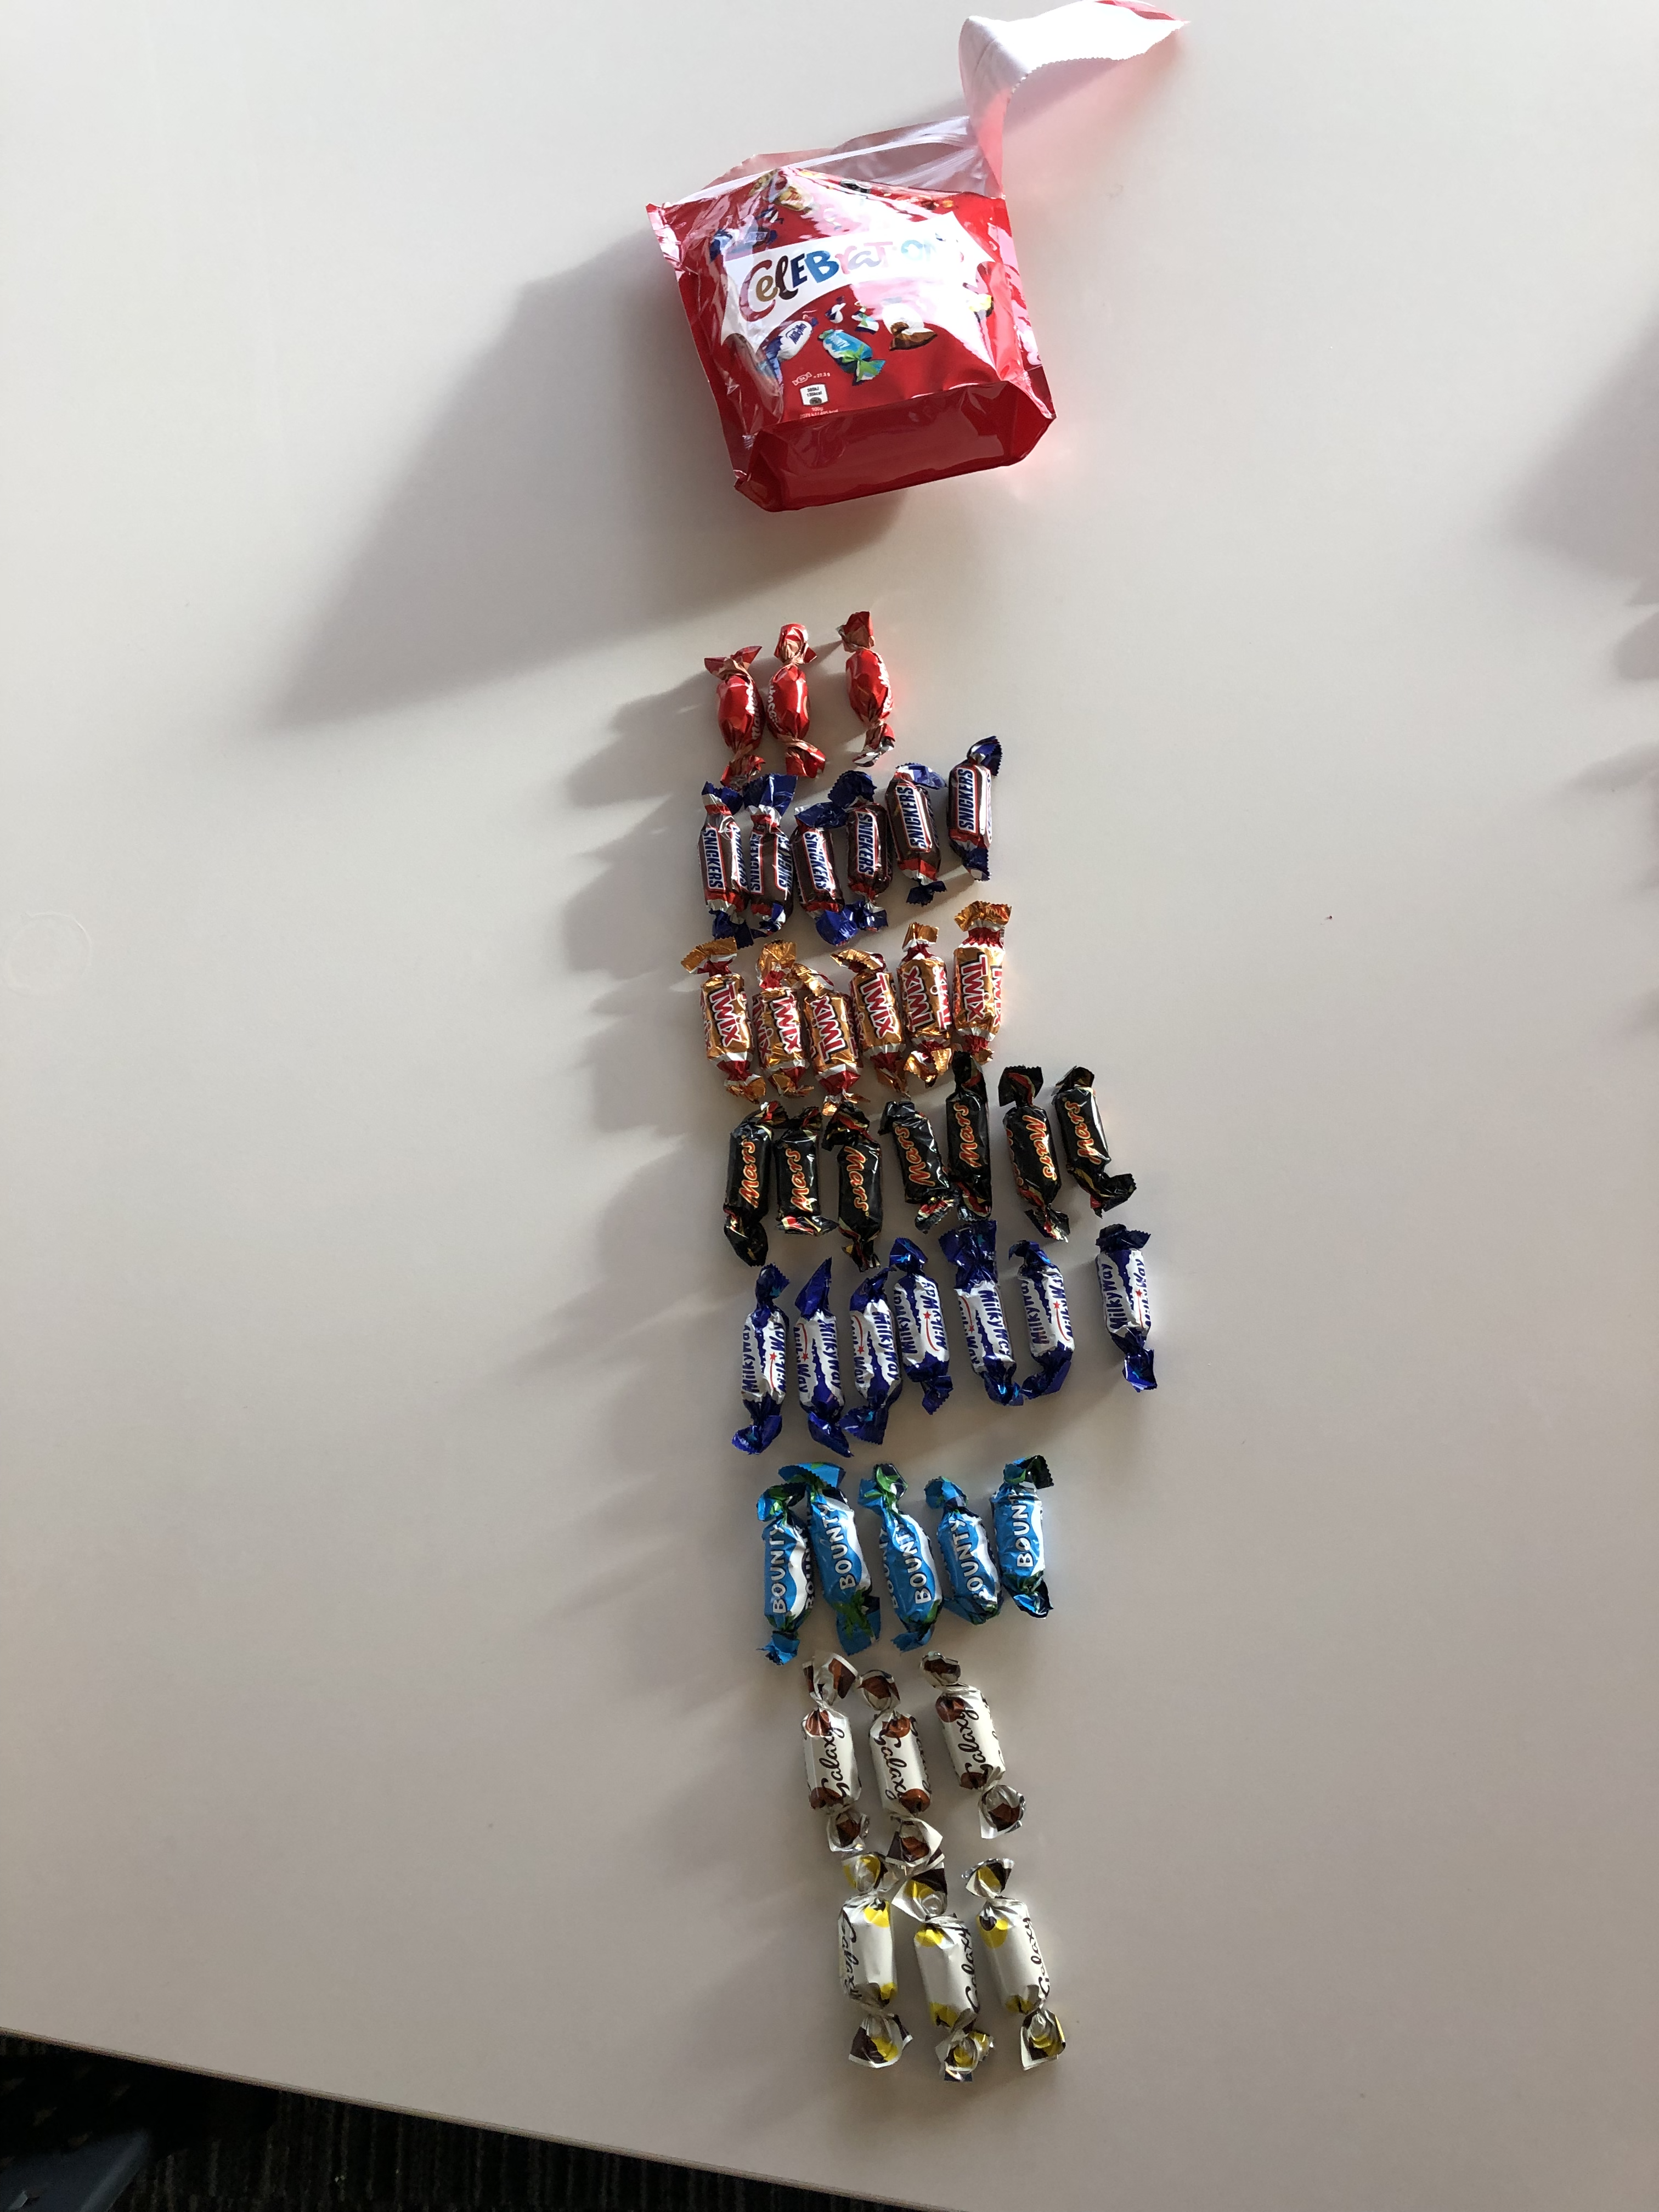
We can organise the individuals in the Mars sample, as shown in Figure 2.3. This gives us enough information to calculate species richness and evenness for this community.
2.3.1 Species richness
We can easily count the number of different species, as distinguished by morphology and membrane features, in Figure 2.3. There are eight (8) species, and this is a quantitative measure of species richness.
Taken in isolation though, this number doesn’t tell us very much. We would need other information - maybe from other samples - to know whether eight is a large, small, or intermediate number of species. Nor does this number tell us whether all species are represented to the same extent (even if, from looking at Figure 2.3 we can tell they are not). We need to consider evenness for that.
2.3.2 Species evenness
We can see visually from Figure 2.3 that there are not equal amounts of each species, so the community is not perfectly even in terms of species evenness. But the question remains open: how do we combine richness and evenness together into a single number (called an index) to understand species diversity in our sample?
We will discuss a simple measure of species diversity, Shannon Index, in the next chapter.
OK, we actually went to Sainsbury’s Local. The one on Buchanan Street. But the sweets are technically from Mars.↩︎