2 Loading a Phylogenetic Tree
2.1 Introduction
As noted in Chapter 1, you will generally encounter phylogenetic trees as a plain text file in one of a handful of common file formats, such as:
newick, file ending.new,.nwk,.newickNEXUS, file ending.nex,.nexusphylip, file ending.phy,.phylip
Whichever software tool you use to read and visualise your tree, you will need to load your data into that tool. In iToL you need to upload the data to the server. In figtree or dendroscope you would open the file in the application. Using ggtree in R, you would write code to open the file and run commands to visualise it.
In this workshop we will be using the online iToL service to visualise and interpret trees. This does not require you to install any software on your machine. The iToL service is available at the link below.
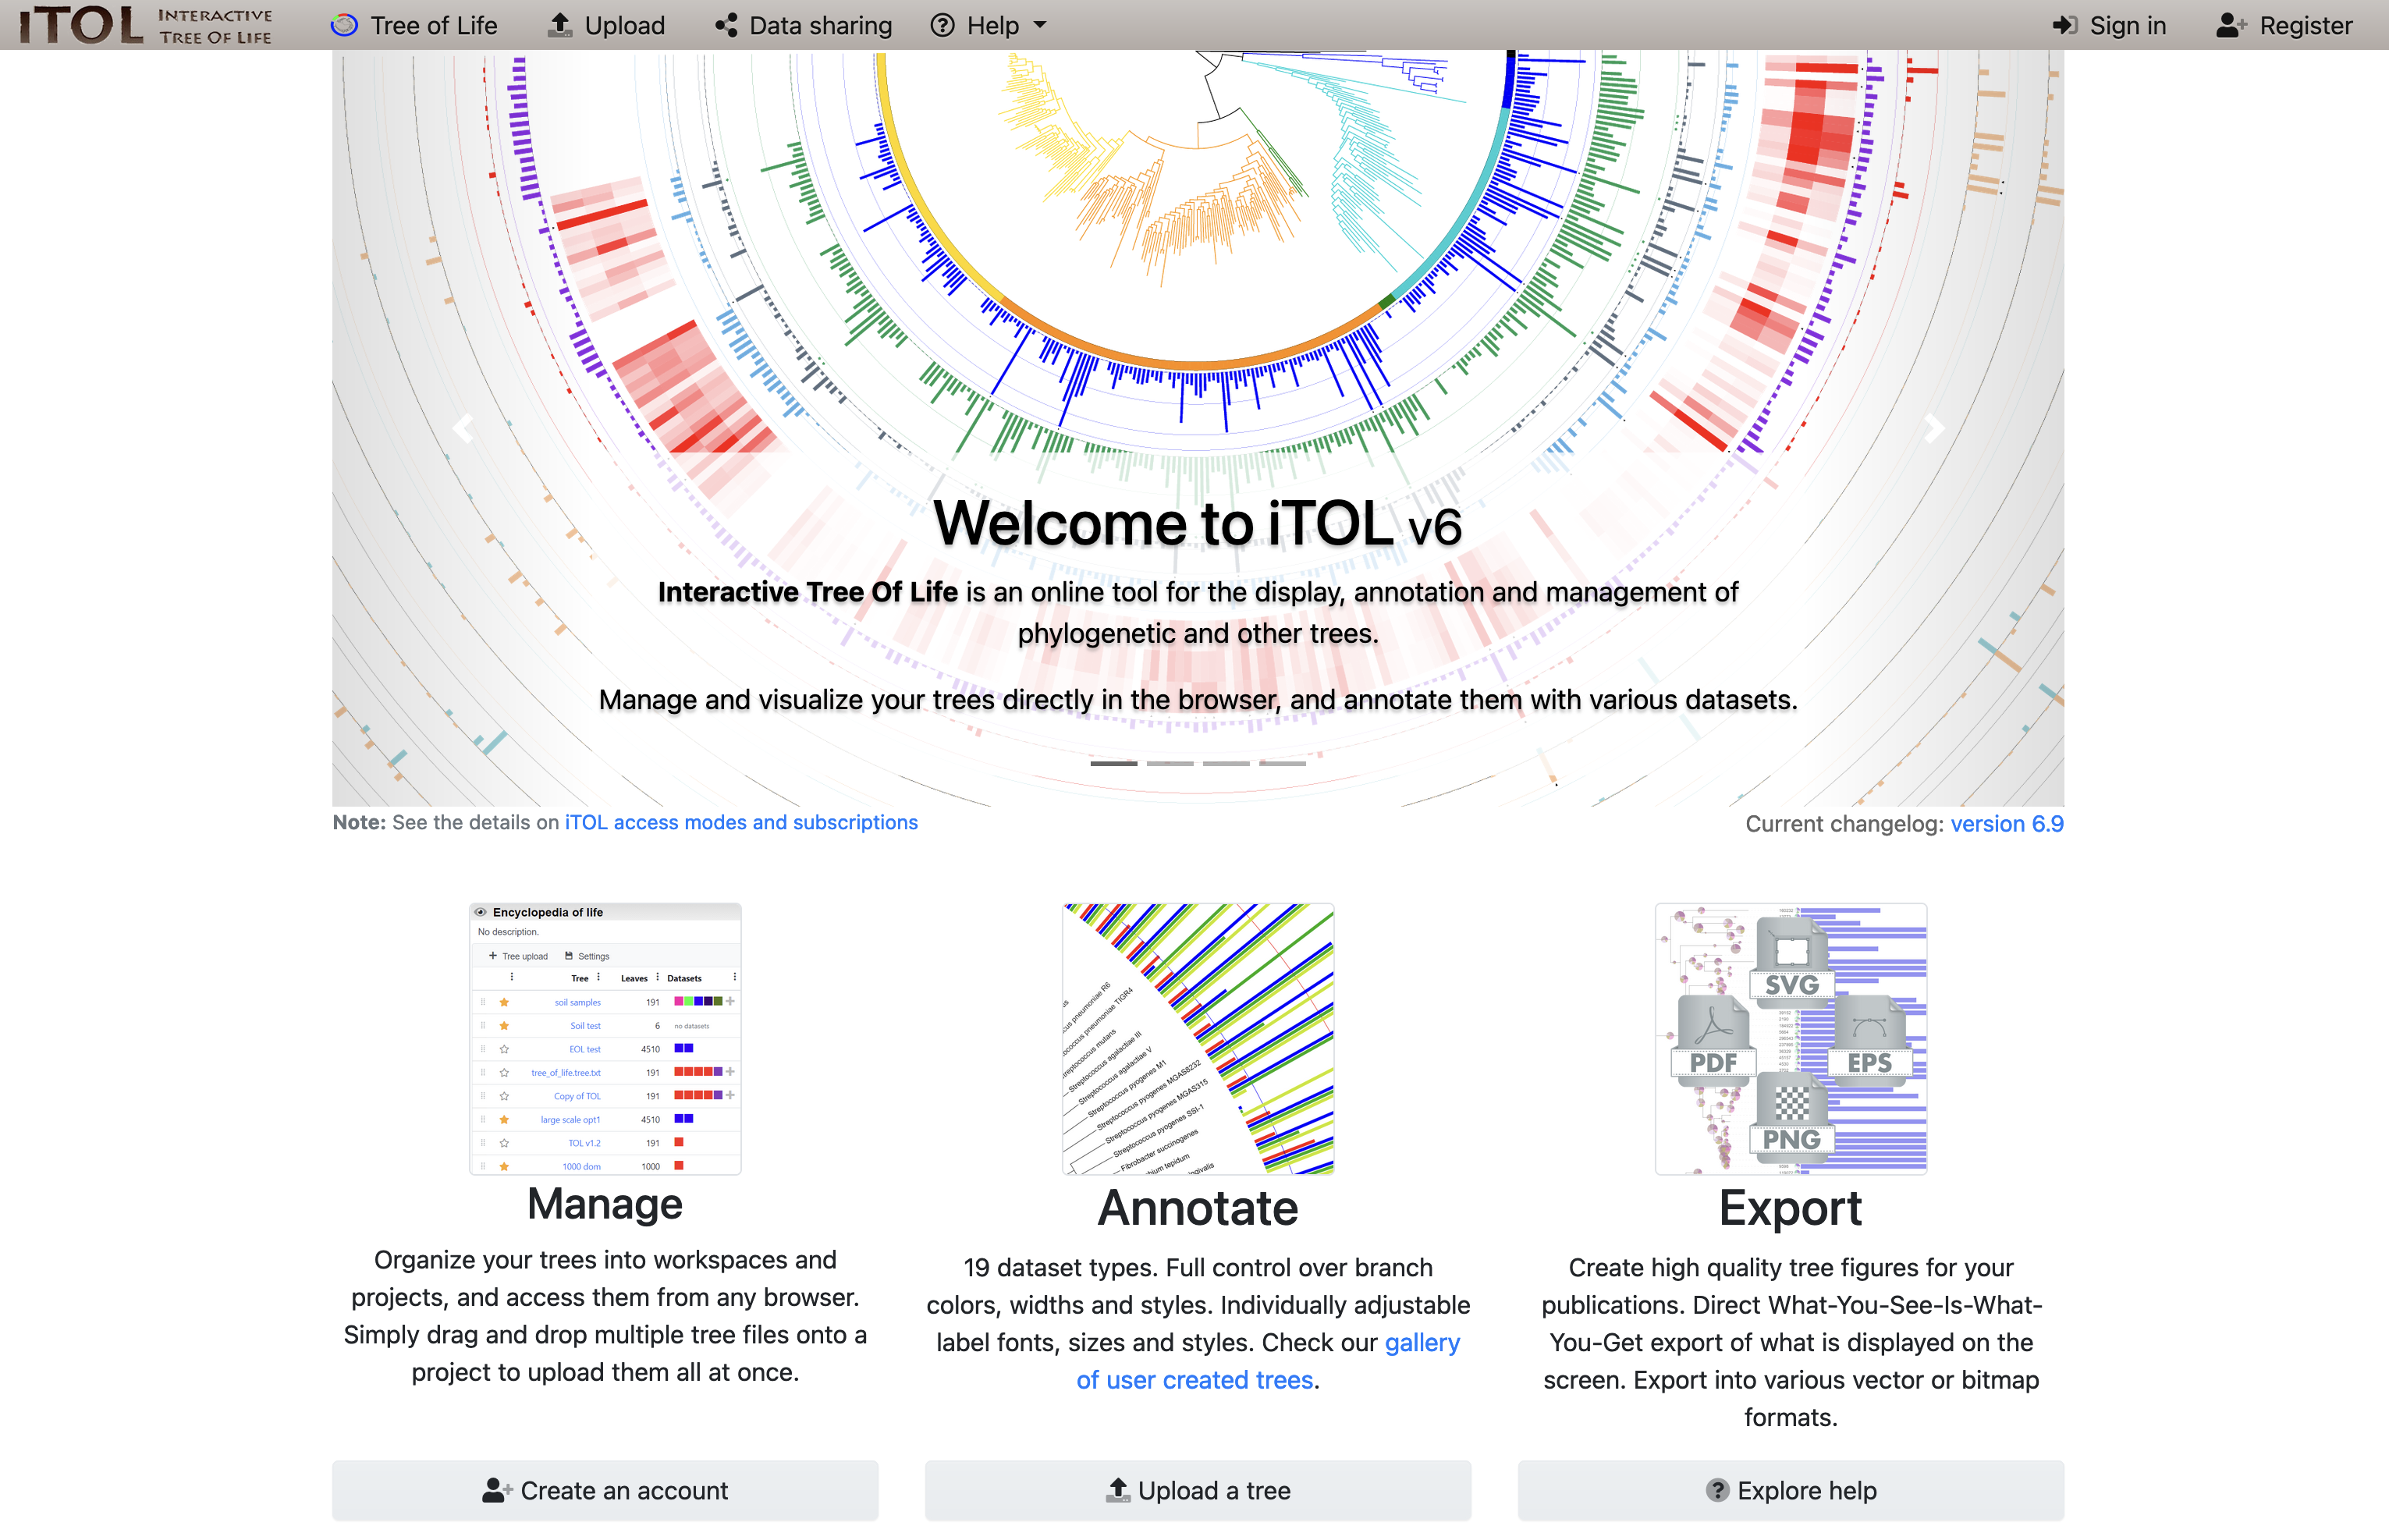
iToL landing page at https://itol.embl.de.
2.2 Load your tree data
Your tree data is in a file called tree_newick.nwk. This tree file describes a phylogeny with 13 samples, and it should be downloaded to your computer from the link below.
If you single-click on the link below, the tree file will open in your browser.
If you right-click on the link, you will see a context menu with the option Save link as… (or similar, depending on your operating system/browser). This will allow you to save the file to your computer.
Download the tree file tree_newick.nwk to your computer.
Right-click on the link above and use Save link as… to save the file on your computer.
Upload the tree file tree_newick.nwk to iToL.
- Click on the
Uploadbutton (Figure 2.2) to see the tree file upload page - Follow the instructions on the page

iTol tree file upload button.
- Click on the
Uploadbutton (Figure 2.2) to see the tree file upload page - Enter a name for the tree in the
Tree name:field. - Click on the
Browsebutton, and select your downloadedtree_newick.nwkfile. The name of the file will appear next to the button. - Click on the
Uploadbutton
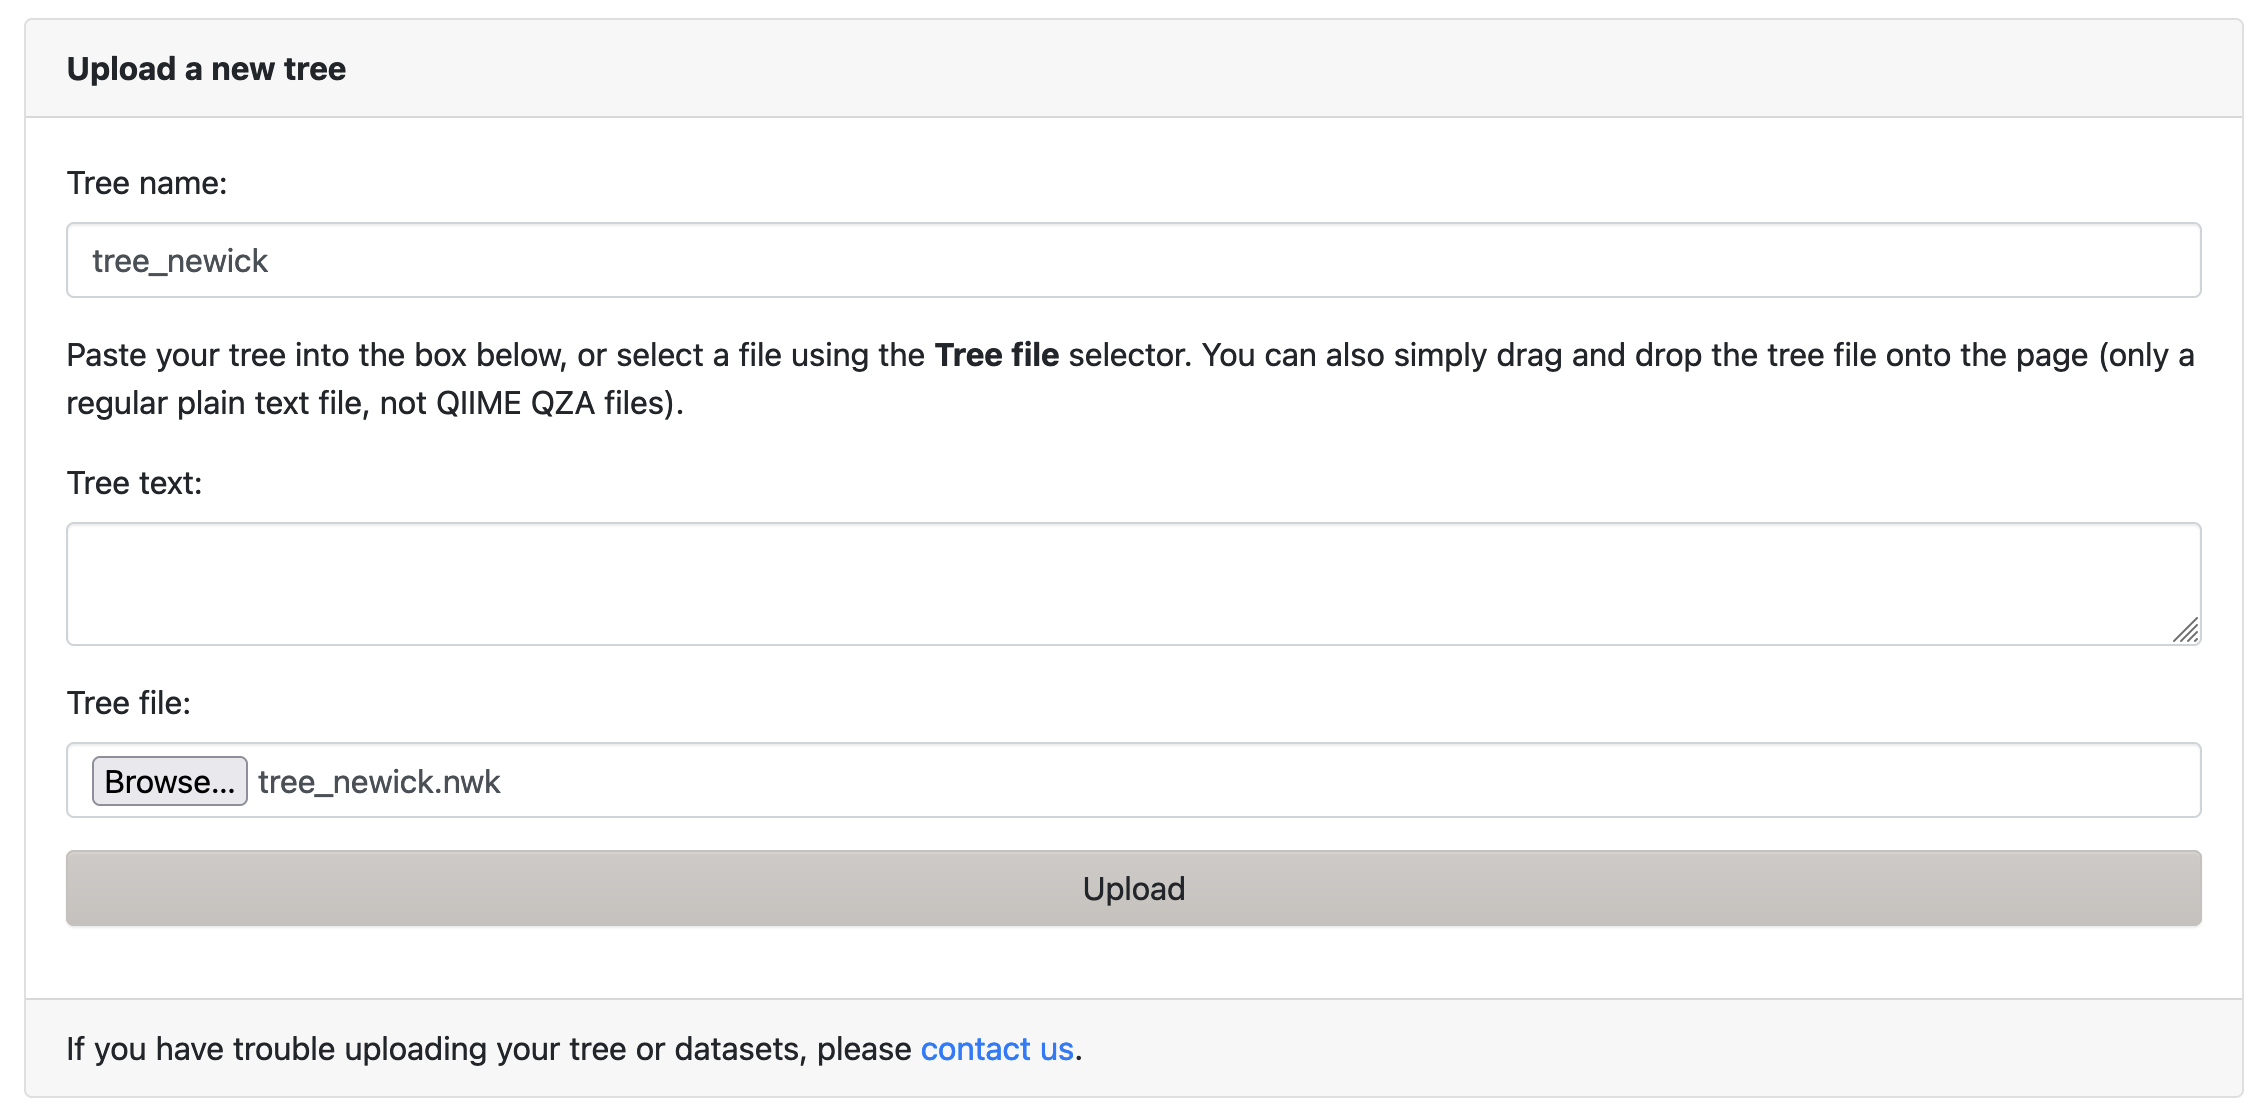
iToL tree file upload page.
After uploading the tree, iTol should present the default tree view, as in (Figure 2.4).
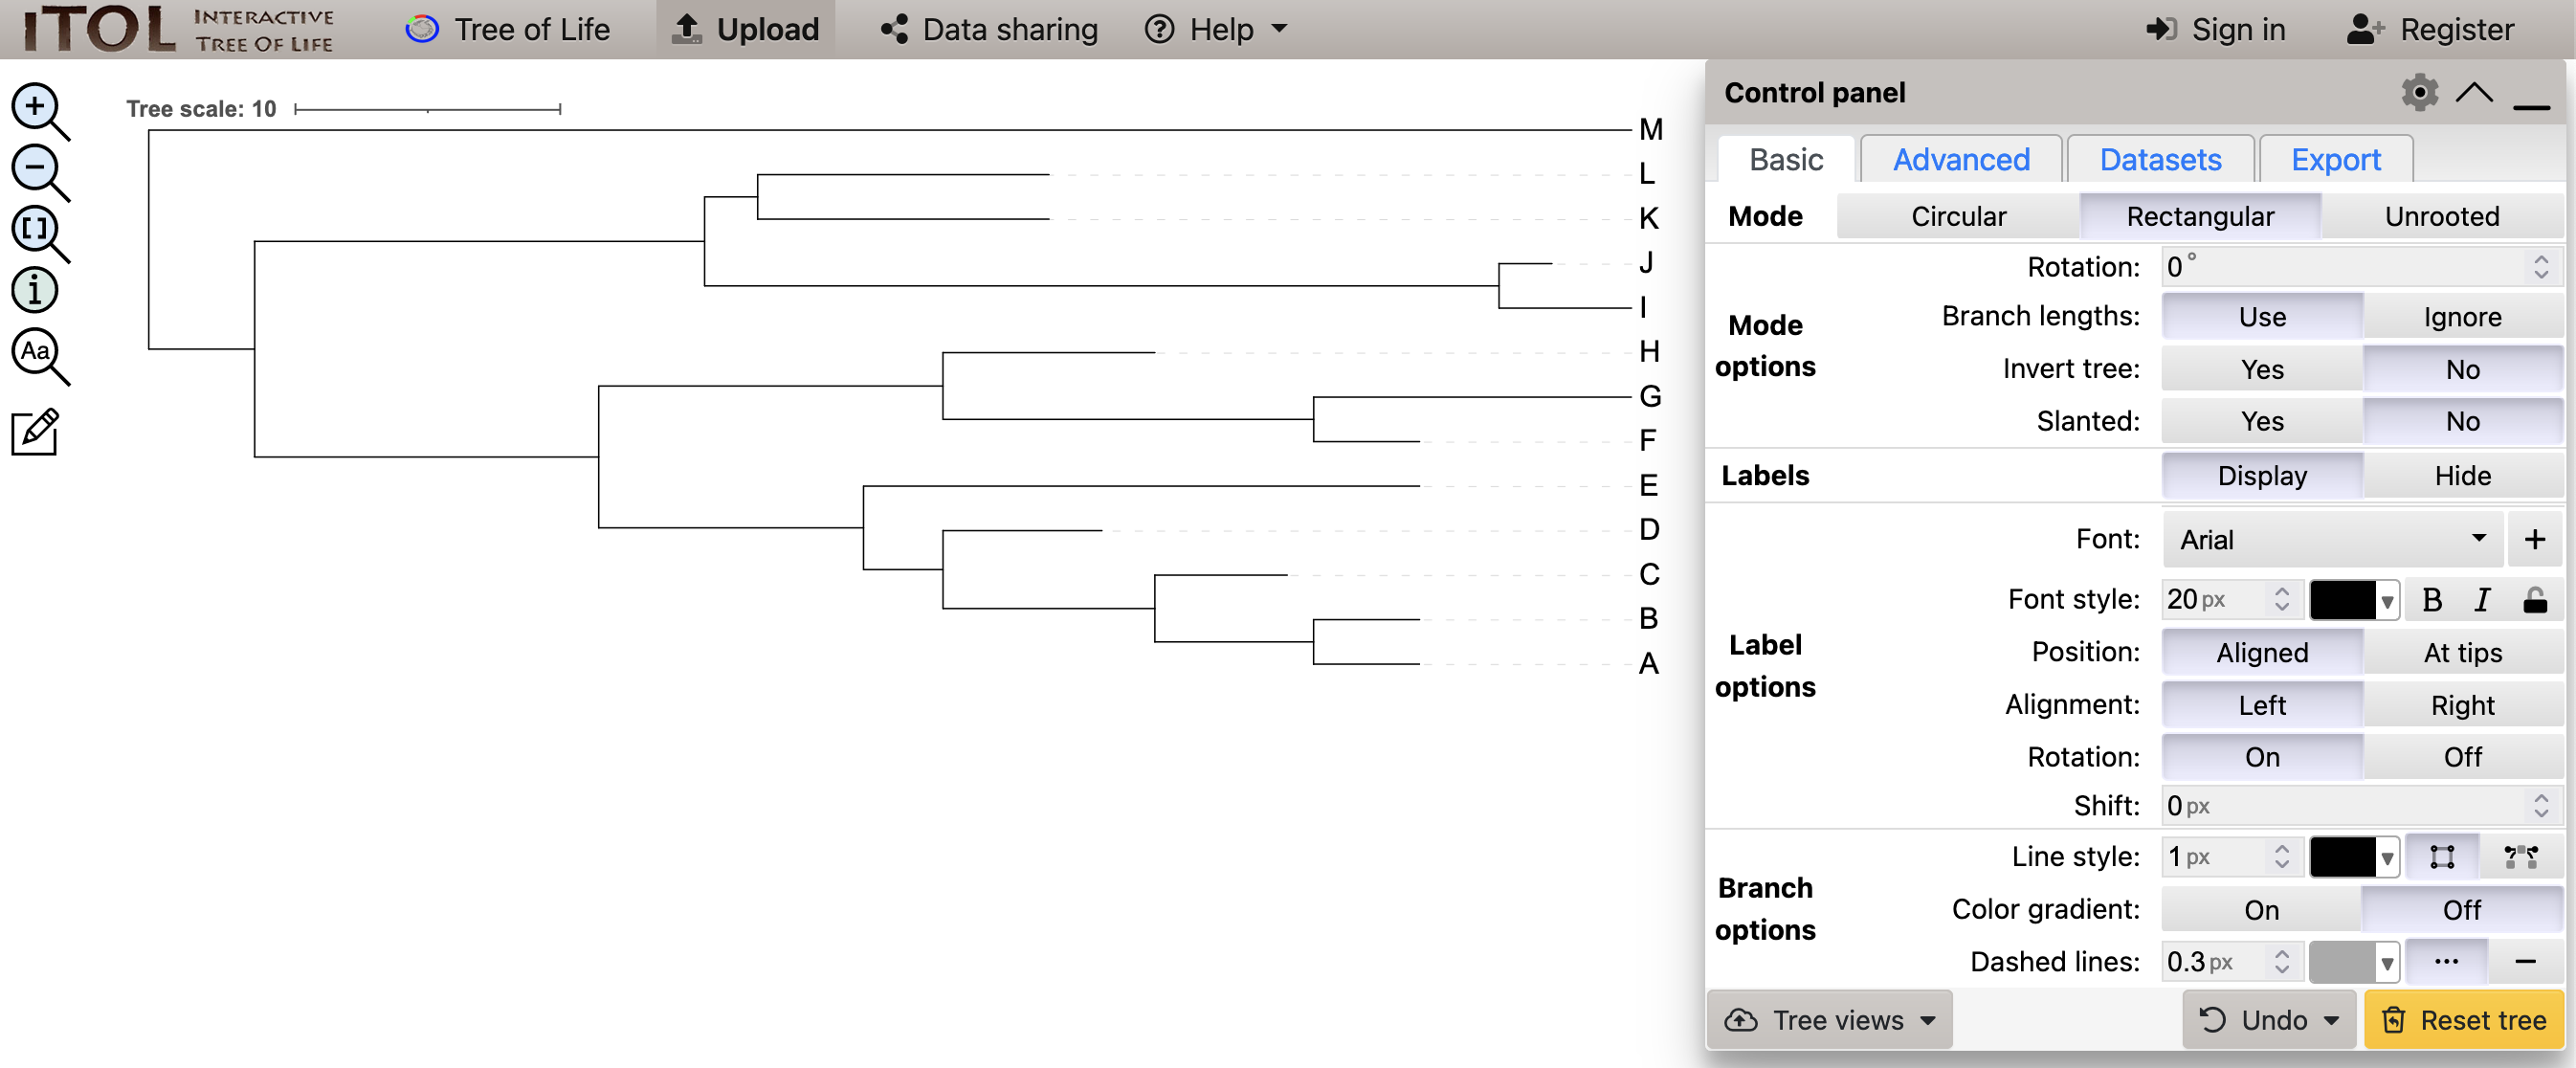
iToL view of the uploaded tree_newick.nwk tree.
2.3 Understanding your tree
Considering the newick file contents you saw in Chapter 1 (and shown below), you might expect that the tree shows relationships between species represented by the letters A-M in that file:
(((((((A:4,B:4):6,C:5):8,D:6):3,E:21):10,((F:4,G:12):14,H:8):13):13,((I:5,J:2):30,(K:11,L:11):2):17):4,M:56);The tree iTol presents at first (Figure 2.5) shows these relationships.

tree_newick.nwk file.
- the tree is a set of bifurcating branches that spread out from the most recent common ancestor (MRCA) and represent an estimated evolutionary history
- this is a rooted tree, so the most recent common ancestor (MRCA) is considered to be represented at the very far left of the tree, at its root
- in this tree, ancestors are on the left, and descendants are on the right
- the horizontal dimension in this plot shows the amount of genetic change since the MRCA - less change towards the left-hand side, more towards the right
- this tree is a phylogram, which means that the lengths of the branches are meaningful and represent the amount of genetic change
Branch lengths are usually drawn in units of substitutions per site - the estimated total number of nucleotide substitutions, divided by (normalised to) the length of the sequence.
You may sometimes see alternative units being used, such as estimated time, or the percentage of sites that have changed.
In Figure 2.5 which species shows the most genetic change since the MRCA?
AEGK
2.3.1 Trees and time
The general relationship between the phylogram you have made and time is shown in Figure 2.6.
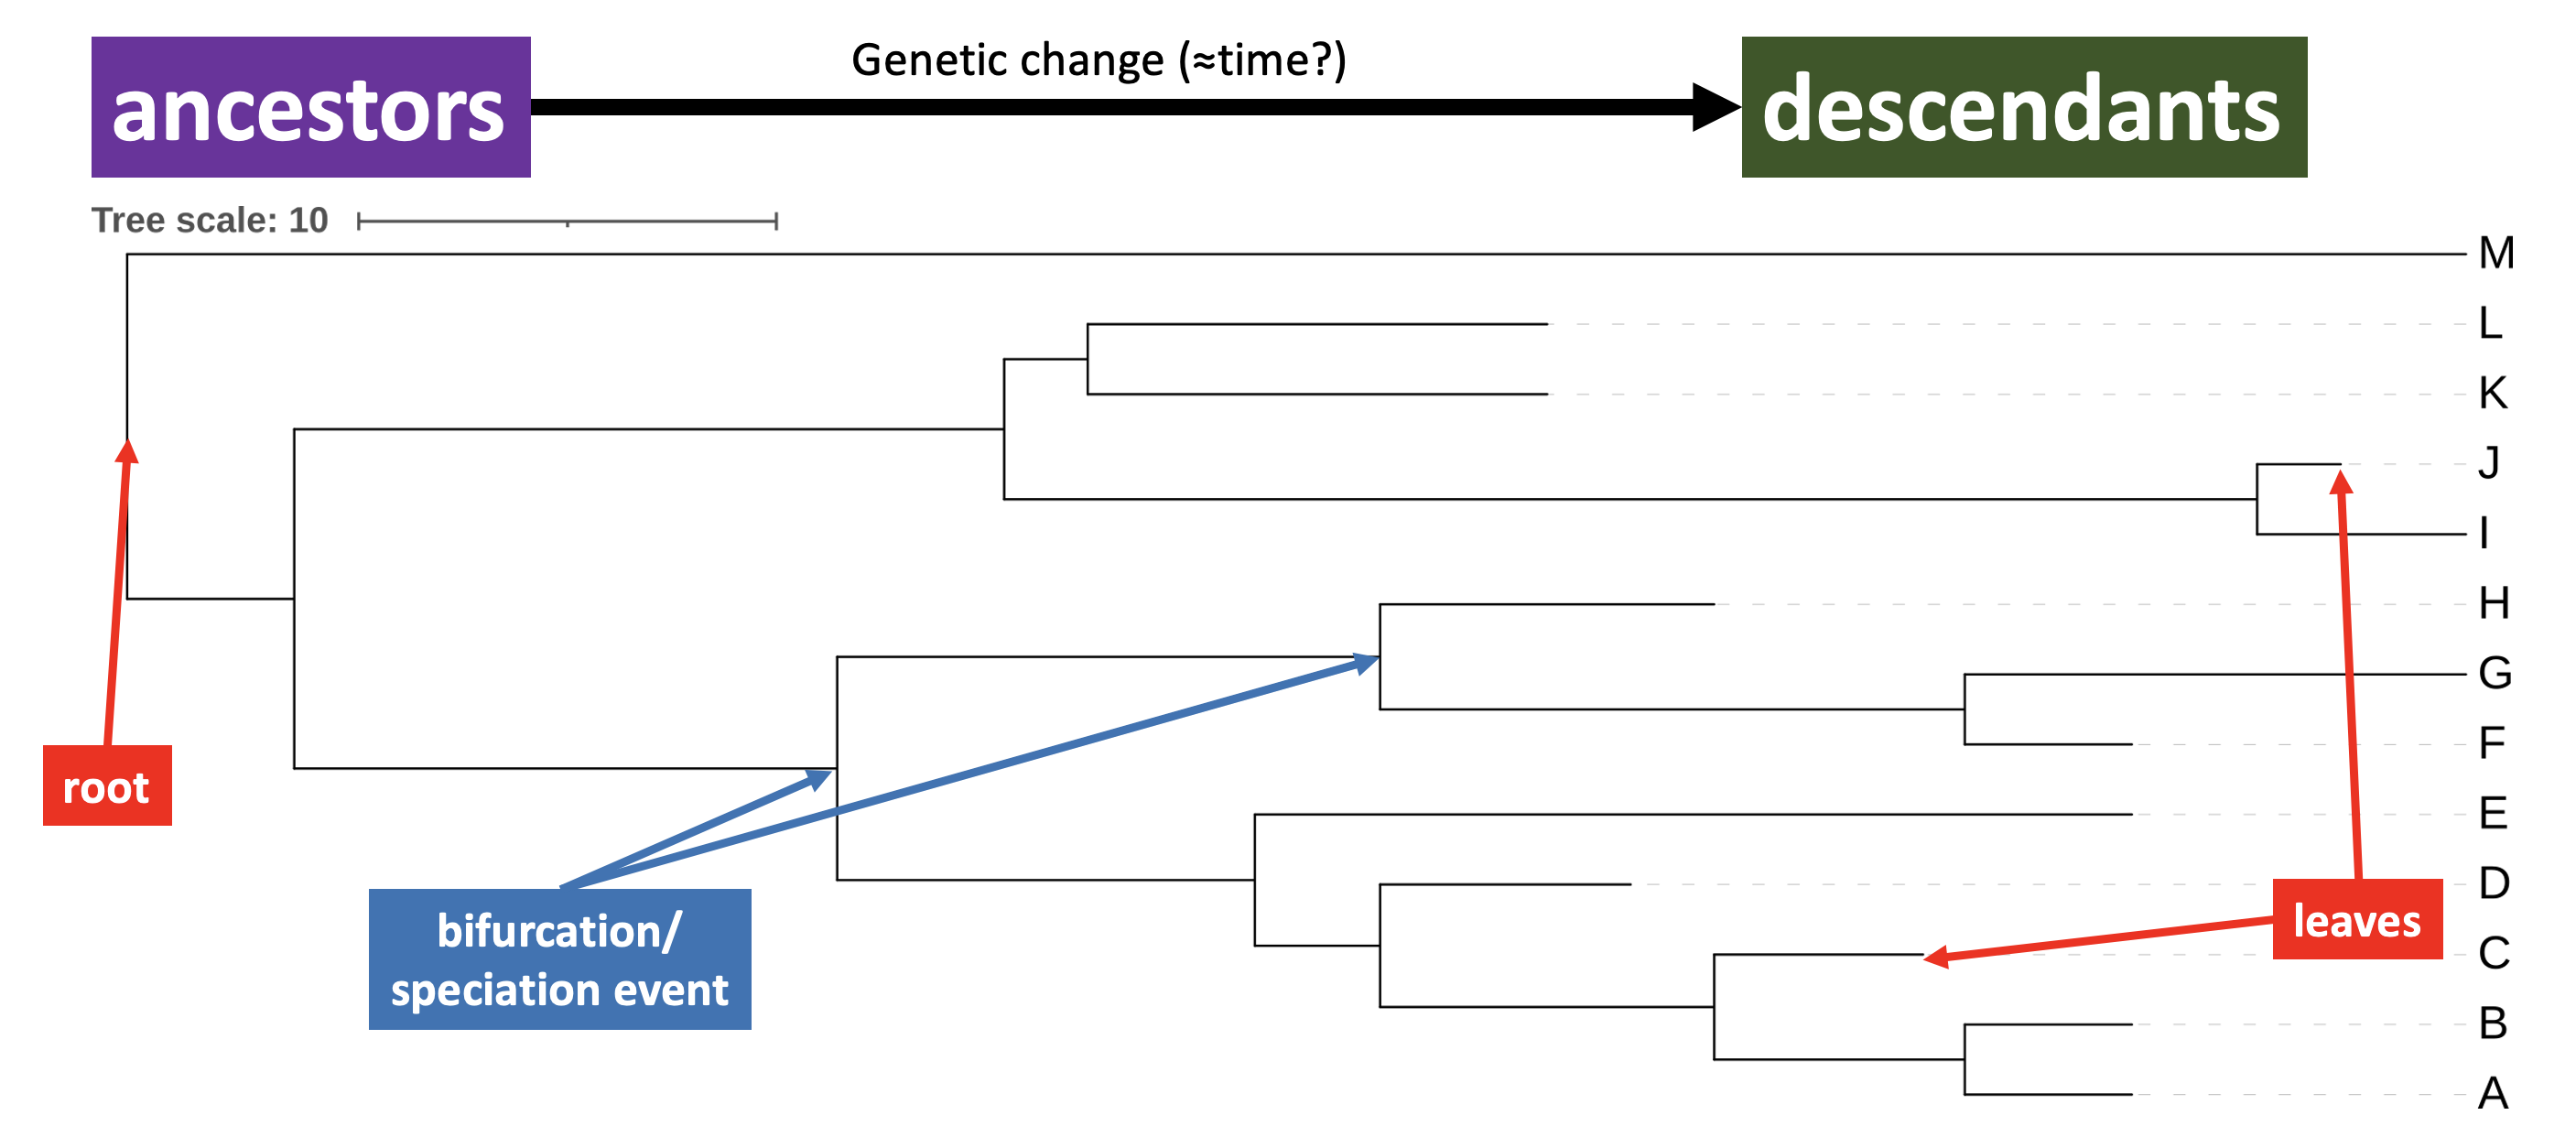
iToL phylogram annotated with root, leaves, bifurcations, and the relationship between ancestors and descendents.
As the tree represents genetic change, and the rate of genetic change may not be constant in all sequences or organisms, we can’t immediately interpret branch lengths in terms of elapsed time. But, when the sequences/organisms used to build the tree are known to exist now, we can say that the leaves of the tree approximately represent the current date.
There are phylogenetic techniques that allow us to convert genetic distances into approximate times, but they are beyond the scope of this workshop.
- currently existing species (
A-M) - the input for building the tree - are shown at the leaves (or leaf nodes) of the tree, at the ends of the branches - the branching events (bifurcations) show how evolutionary lineages split, as the amount of genetic change since the MRCA increases from left to right; they represent events in evolution where a population divides into two subgroups the go on to have distinct genetic histories
- in a biological context, this process is often referred to as speciation
- the order of bifurcation since the MRCA can be interpreted as the order in which speciation events occurred
- the amount of genetic change between branching events is represented by the length of the branch that separates them; the scale bar allows you to interpret the branch length quantitatively
Figure 2.5 implies that which speciation event was the earliest in time?
- the speciation separating
AandB - the speciation separating
BandC - the speciation separating
BandD - the speciation separating
CandE
2.3.2 Ancestry and history
Phylogenetic trees represent patterns of shared ancestry and history between lineages. For instance, in Figure 2.7 common and unique ancestors of A, B and C are indicated, as are common and unique histories of I and J.
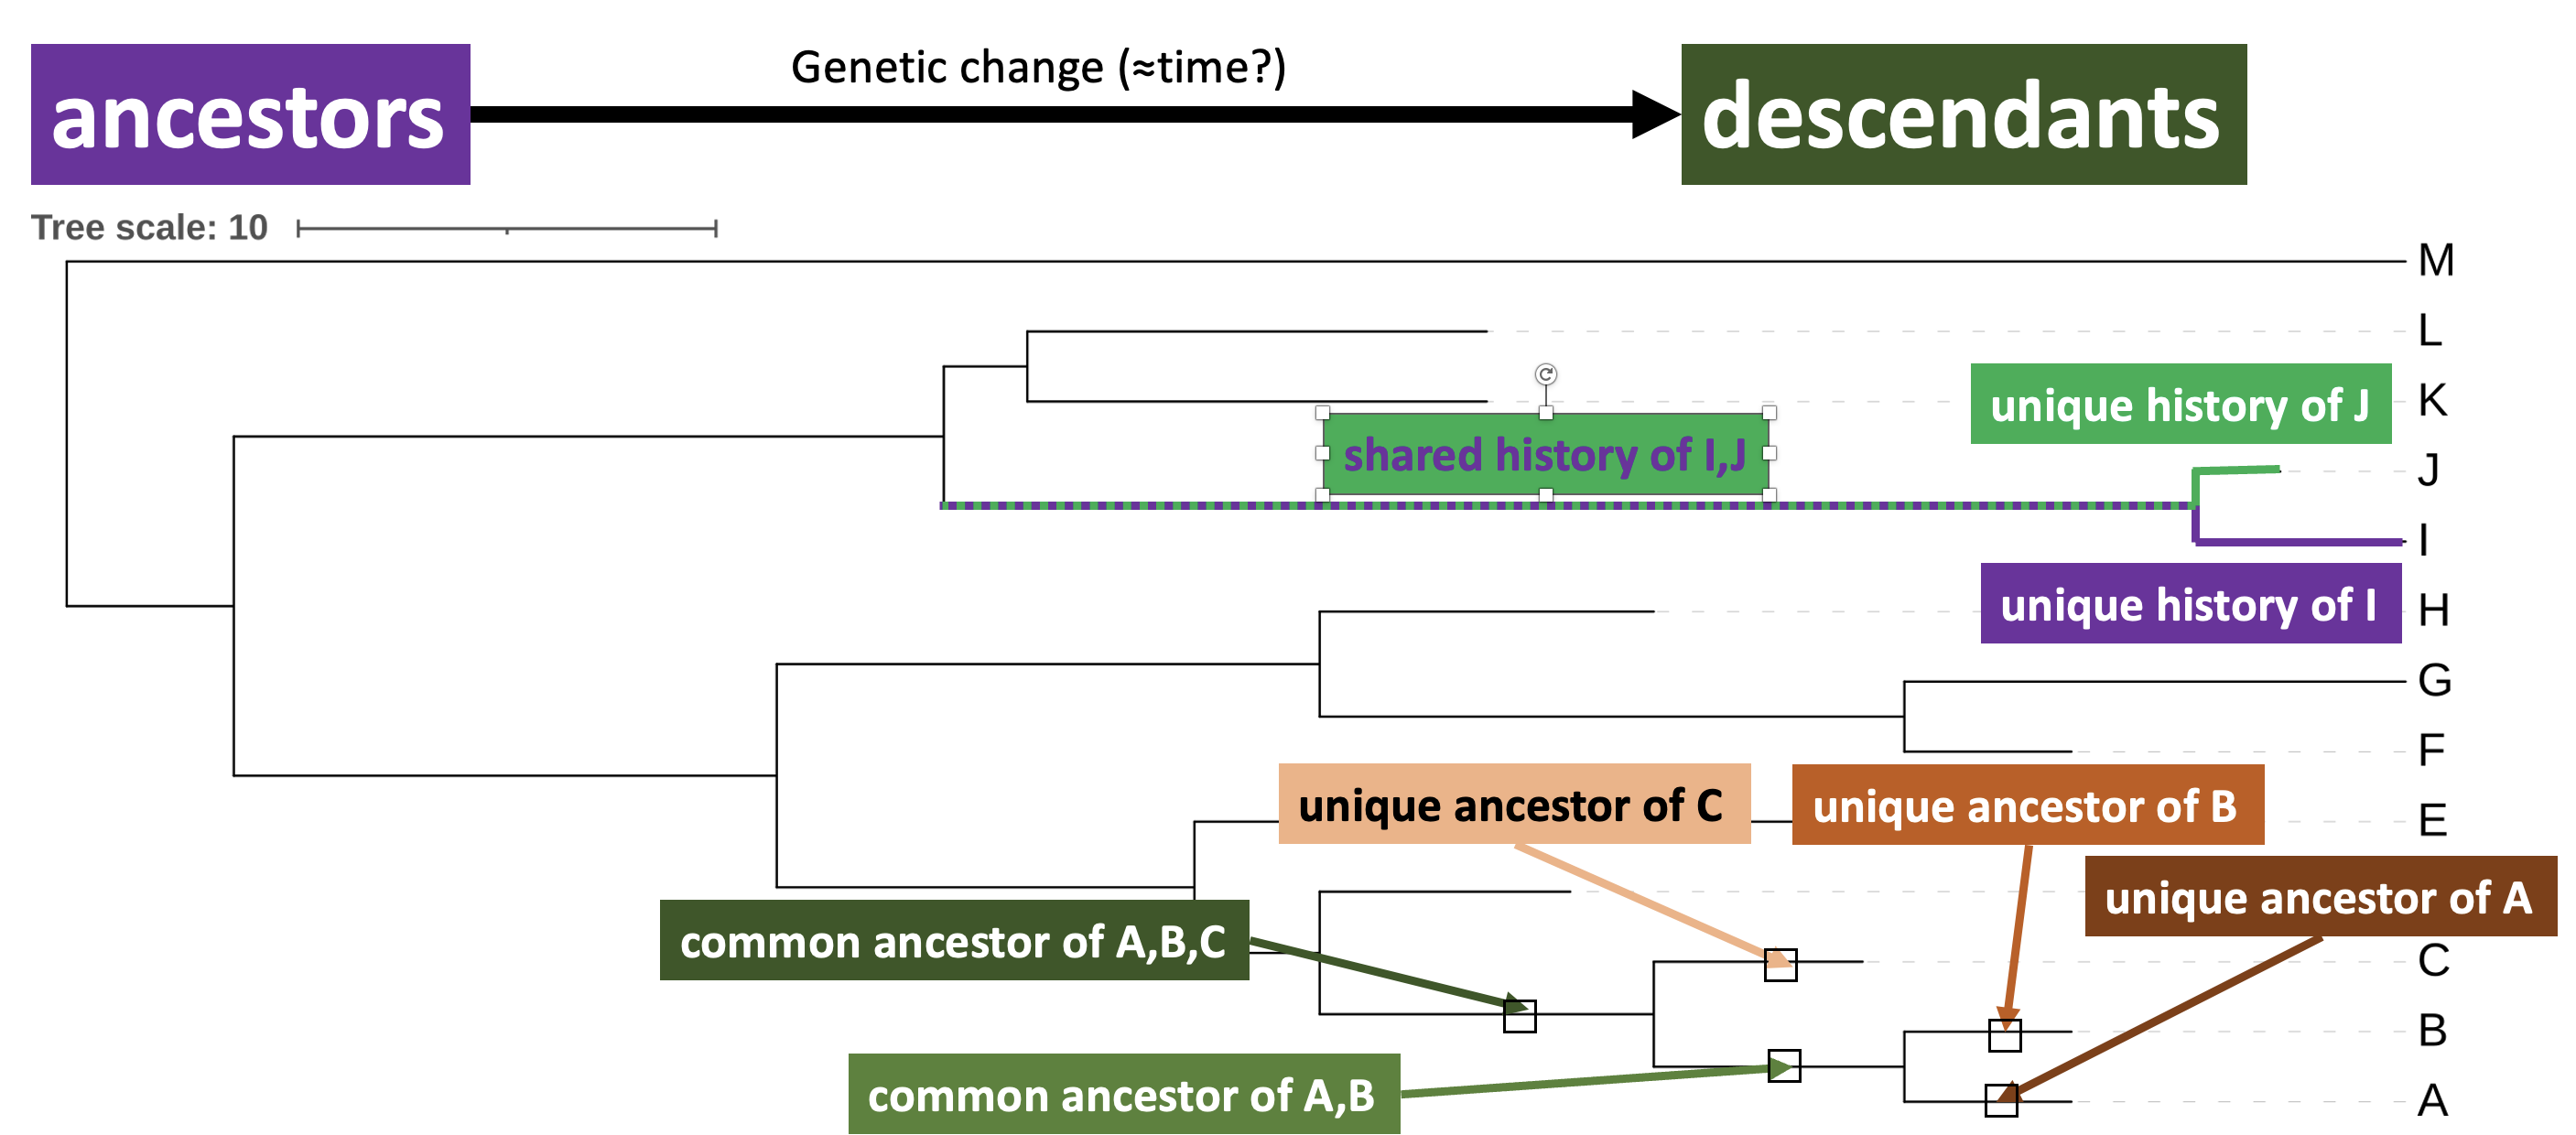
iToL phylogram annotated with unique and shared ancestries and histories. Ancestors are single points on a branch (represented here as boxes), whereas histories are the entire set of ancestors represented by a branch.
In Figure 2.5 which of the following accumulated the greatest amount of genetic change?
- the unique history of
E - the shared history of
IandJ - the shared history of
I,J,K, andL - the unique history of
D
2.3.3 Clades
A clade is a grouping on the tree that includes a common ancestor and all of its descendants. We call a group with these properties monophyletic (i.e. it comprises a single phylum). Figure 2.8 shows examples of clades in the iToL tree you generated.
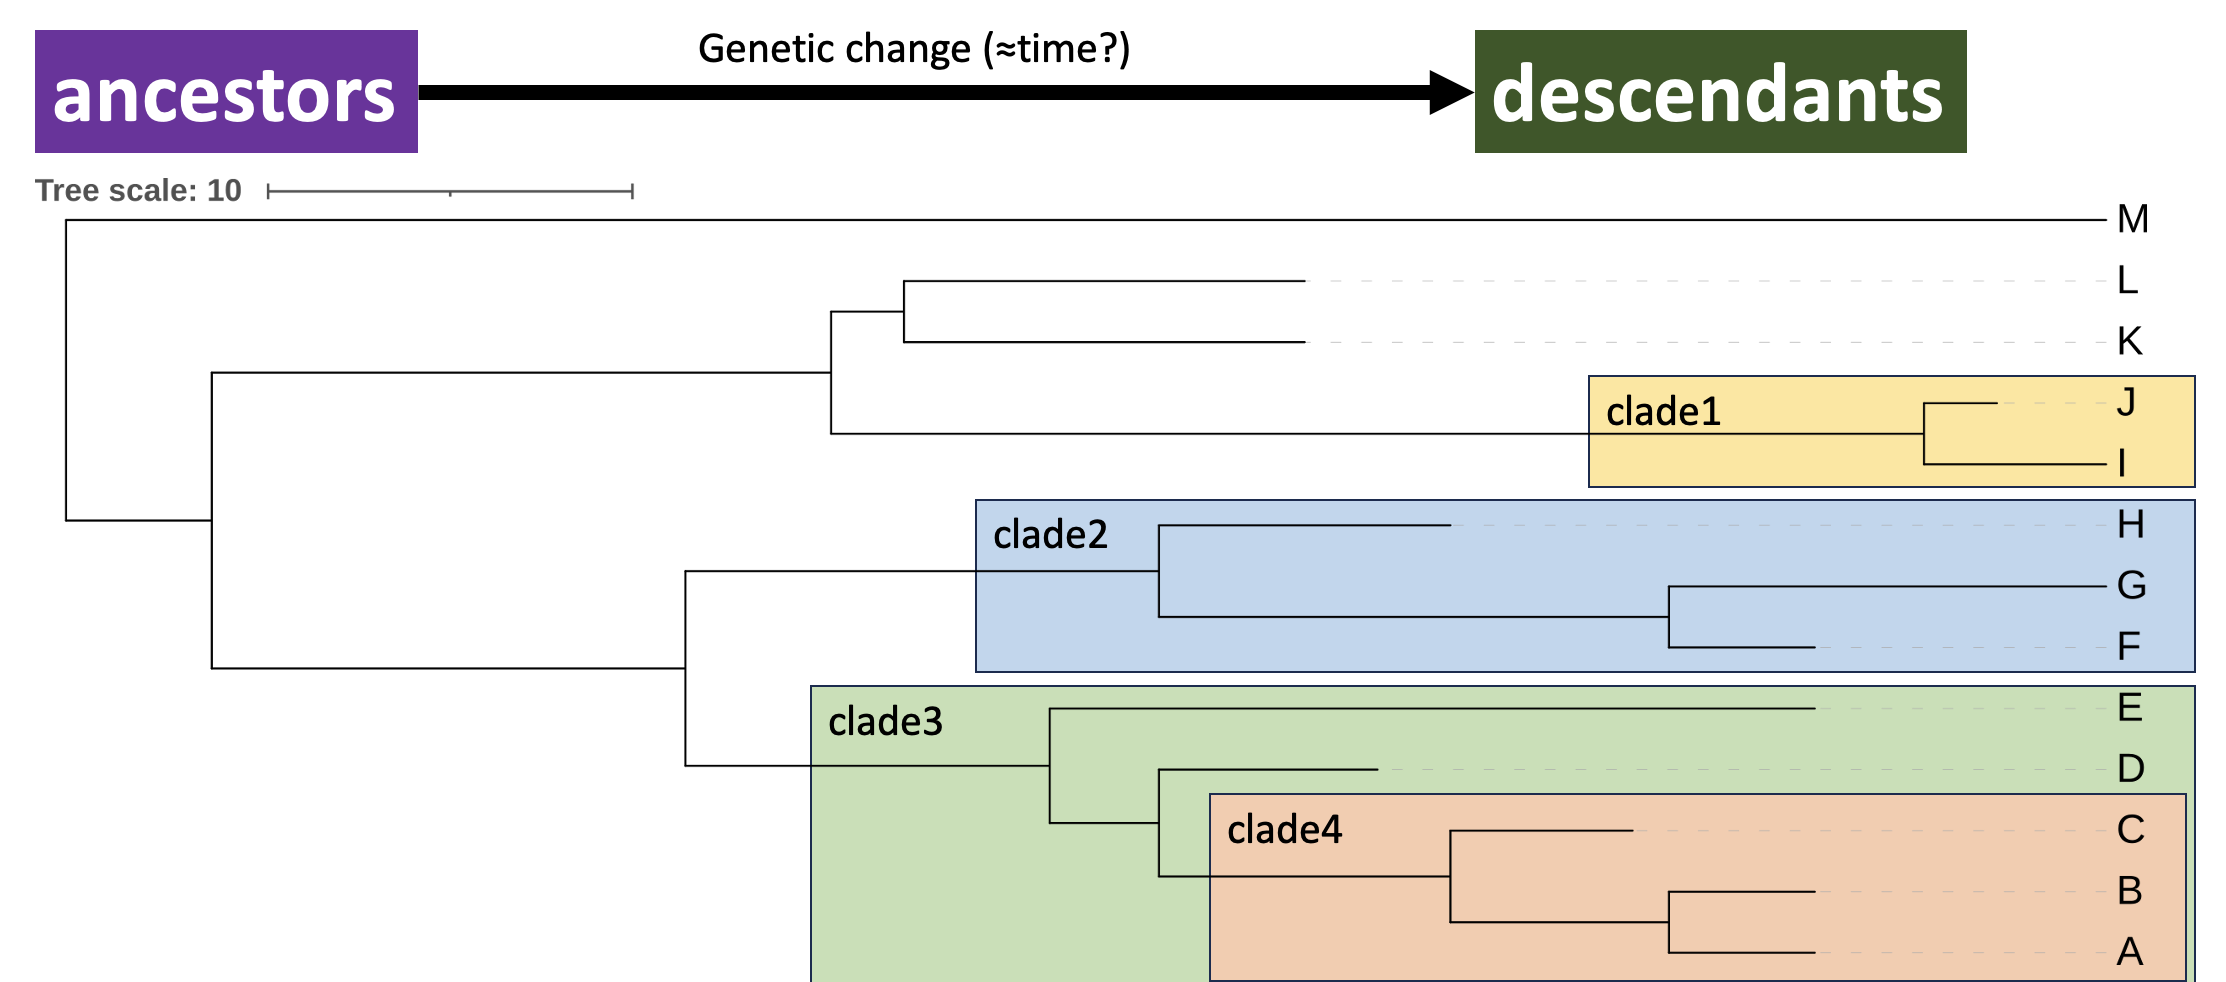
iToL phylogram annotated with clades, groupings on the tree that include a common ancestor and all its descendants. Clades can be nested inside each other as a hierarchy. Clade4 (A, B, C) is completely contained within Clade3 (A, B, C, D, E).
In Figure 2.5 which of the following groups of leaf nodes form a clade?
- (
J,K,L) - (
F,G,H) - (
D,E) - (
K,L)
2.4 Summary
After successfully working through this section you should be able to:
- upload a phylogenetic tree into
iToL - explain the meaning of branching events and branch lengths in a phylogenetic tree, and interpret the speciation events in a tree
- explain how a phylogenetic tree represents history and ancestry
- explain the concept of a clade in phylogenetics, and identify one on a phylogenetic tree
Please answer the questions below in the formative quiz on MyPlace