4 Scenario 1: 16S Identification
4.1 Introduction
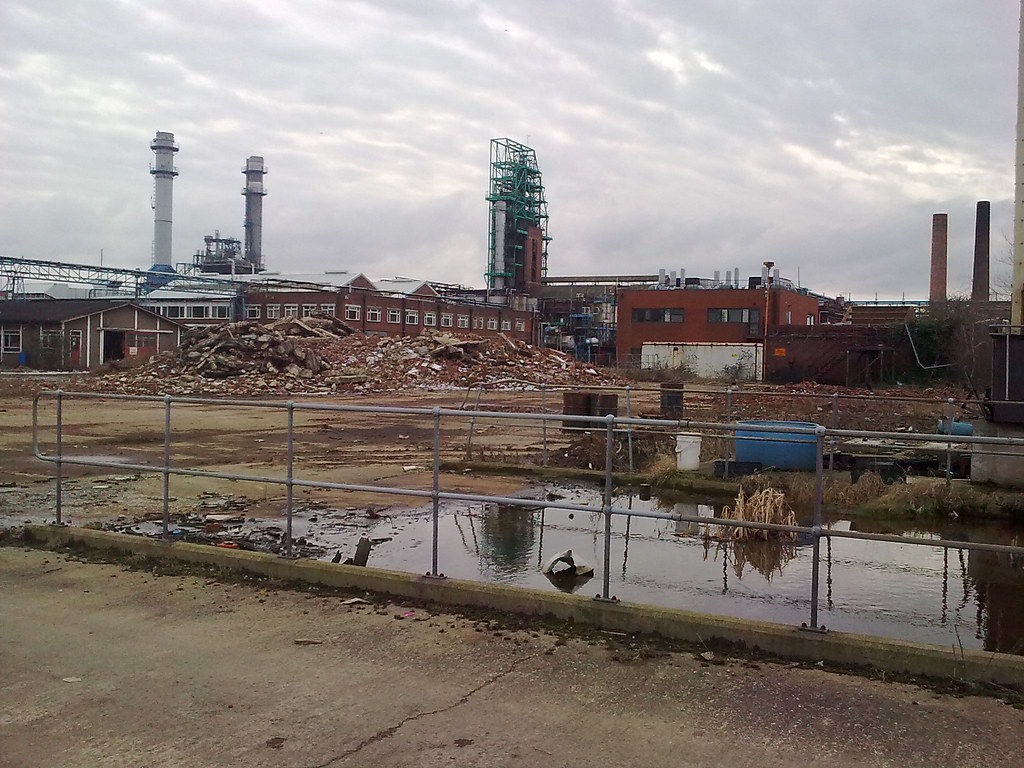
You have been investigating a heavily-contaminated industrial site (Figure 4.1), where you identified a biofilm growing on some chemical waste. It is possible that bacteria in this biofilm may produce enzymes useful for degrading toxic chemical waste and you would like to identify the species that might be present, so you can research more about their potential use in bioremediation of contaminated sites.
To make this identification, you have used PCR to amplify 16S rDNA genes from the genomic DNA of the colony of bacteria you isolated from a sample of that biofilm.
It is still common in microbiology to make an identification of bacteria by their 16S rDNA or rRNA sequence. For a pure isolate, this can be done using targeted PCR primers to amplify the gene from the organism’s genomic DNA (gDNA), and comparing the sequence obtained to a database of 16S gene sequences from known organisms.
16S rRNA has a sequence that is well-conserved across all bacteria, due to its essential role as a scaffold in the small ribosomal subunit that is necessary for gene translation. The conserved regions of the gene allow the use of “universal” primers for PCR amplification, whatever the bacteria being studied. However, there are regions of variability where the sequence of nucleotides varies in a way that can be characteristic for a taxon.
By focusing on these variable regions, we can usually place a bacterium correctly at genus level.
You have had the resulting amplicon sequenced by Sanger sequencing, and this resulted in the isolate_1_16S_rDNA sequence shown below.
>isolate_1_16S_rDNA
ACTCTAGTGGCGAACGGGTGAGTAACACGTGGGCGACCTACCCCCAAGTACGGCATAACCCCGGGAAACC
GGAGCTAATTCCGTATGTGCTCGTACCTCCTATGGTACGCGTAAAGATTTATCGCTTGGGGATGGGCCCG
CGGCGCATCAGCTAGTTGGTAGGGTAACGGCCTACCAAGGCGACGACGCGTAGCCGACCTGAGAGGGTGA
CCGGCCACAGGGGCACTGAGACACGGGCCCCACTCCTGCGGGAGGCAGCAGTTAGGAATCTTCGGCAATG
GGCGCAAGCCTGACCGAGCGACACTGCTTGGAGGATGAAGGTTTTCGGATCGTAAACTCCTGAACGAGGG
ACGAATAATGACGGTACCTCGCTAATAGCACCGGCTAACTCCGTGCCAGCAGCCGCGGTAATACGGAGGG
TGCAAGCGTTATCCGGAATCACTGGGCGTAAAGGGCGCGTAGGCGGTTTATTAAGTCCGATGTTAAAGCG
TGAGGCTCAACCTCATCACGGCGTTGGATACTGGCAAGCTGGACGGTTGGAGAGGAAGGTAGAATTACCA
GTGTAGCGGTGGAATGCGTAGATACTGGTAGGAATACCCATTGCGAAGGCAGCCTTCTGGACAACACGTG
ACGCTGAGGCGCGAAAGTGTGGGGAGCAAACCGGATTAGATACCCGGGTAGTCCACACCCTAAACGATGC
ATACTTGGTGTCGGCCCGTTGGGGTCGGTGCCGGAGTTAACGCGTTAAGTATGCCGCCTGGGAAGTACGG
CCGCAAGGTTGAAACTCAAAGGAATTGACGGGGACCCGCACAAGCGGTGGAGCATGTGGTTTAATTCGAA
GCAACGCGAAGAACCTTACCAGGTCTTGACATGCTAGGAACCTCTAAGAGATTAGAGGGTGCCCTTCGGG
GAACCTAGACACAGGTGCTGCATGGCTGTCGTCAGCTCGTGTCGTGAGATGTTGGGTTAAGTCCCGCAAC
GAGCGCAACCCTCGCTATTAGTTACCAGCACTTCGGGTGGGAACTCTAATAGGACTGCCTGTGAAAGCAG
GAGGAAGGCGGGGGTGACGTCTAGTCAGCATGGTCCTTACGACCTGGGCTACACACGTGCTACAATGGCA
GGTATAACGCGTCGCCAACTCGCGAGAGTGCGCTAATCGCTTAAAGCCTGTCCCAGTTCAGATTGTAGTC
TGCAACTCGACTATATGAAGTTGGAATCGCTAGTAATCGCAGATCAGCATTGCTGCGGTGAATACGTTCC
CGGGTCTTGTACACACCGCCCGTCAAACCATGGGAGTAGGTTGCACCCAAAGACGTAACGCTGCGTCAAT
GCGGCTTGTGTTTAAGGTGTGGCTTATGACTGGGGTTAAGTCGTAACAAGGTAACTGTACCGGAAGGTGC
GGTTGGATCACCTCCTTTCTAAGGAGTCAGTAAACAGGCTATTTCATCCCGGATTTTCATACCCCATATT
TTGTGGGCGTTCGTCTATo identify this organism, you want to BLAST the 16S sequence against a suitable database of 16S genes at NCBI. Carry out this search using the guide below (using the hints if you need them) and answer the questions in the formative quiz on MyPlace.
4.2 Analysis Steps
Follow the steps below to carry out the analysis for this scenario. If you need a reminder, please check with the example search in the BLAST introduction chapter. If you need more help, the green boxes below expand to give you a hint for what to do, and the orange boxes expand to give a more direct instruction.
4.2.2 Select the BLAST Tool
BLAST tool should I use?
Your query sequence is a nucleotide sequence, and the 16S sequences of other organisms are also nucleotide sequences, so this is a nucleotide vs nucleotide search.
For a reminder, see Table 3.1
BLAST tool to use
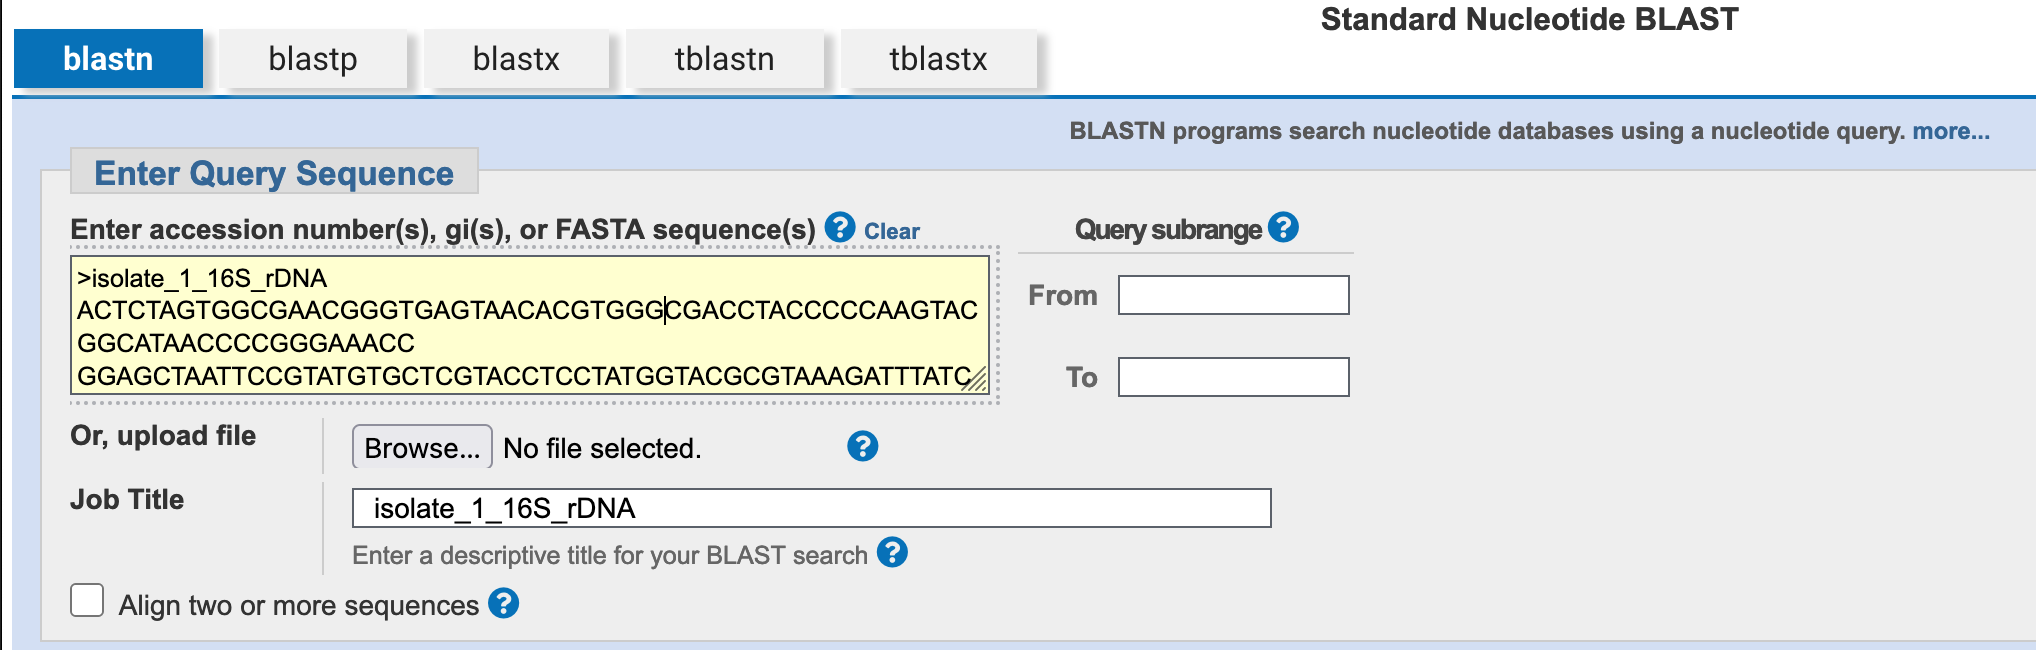
This is a nucleotide vs nucleotide search, so use the Nucleotide BLAST tool.

4.2.3 Enter the query sequence
Paste the nucleotide sequence above into the Enter Query Sequence field.
4.2.4 Set appropriate parameter choices
The NCBI BLAST webservice provides specialised databases for common, well-defined search tasks.
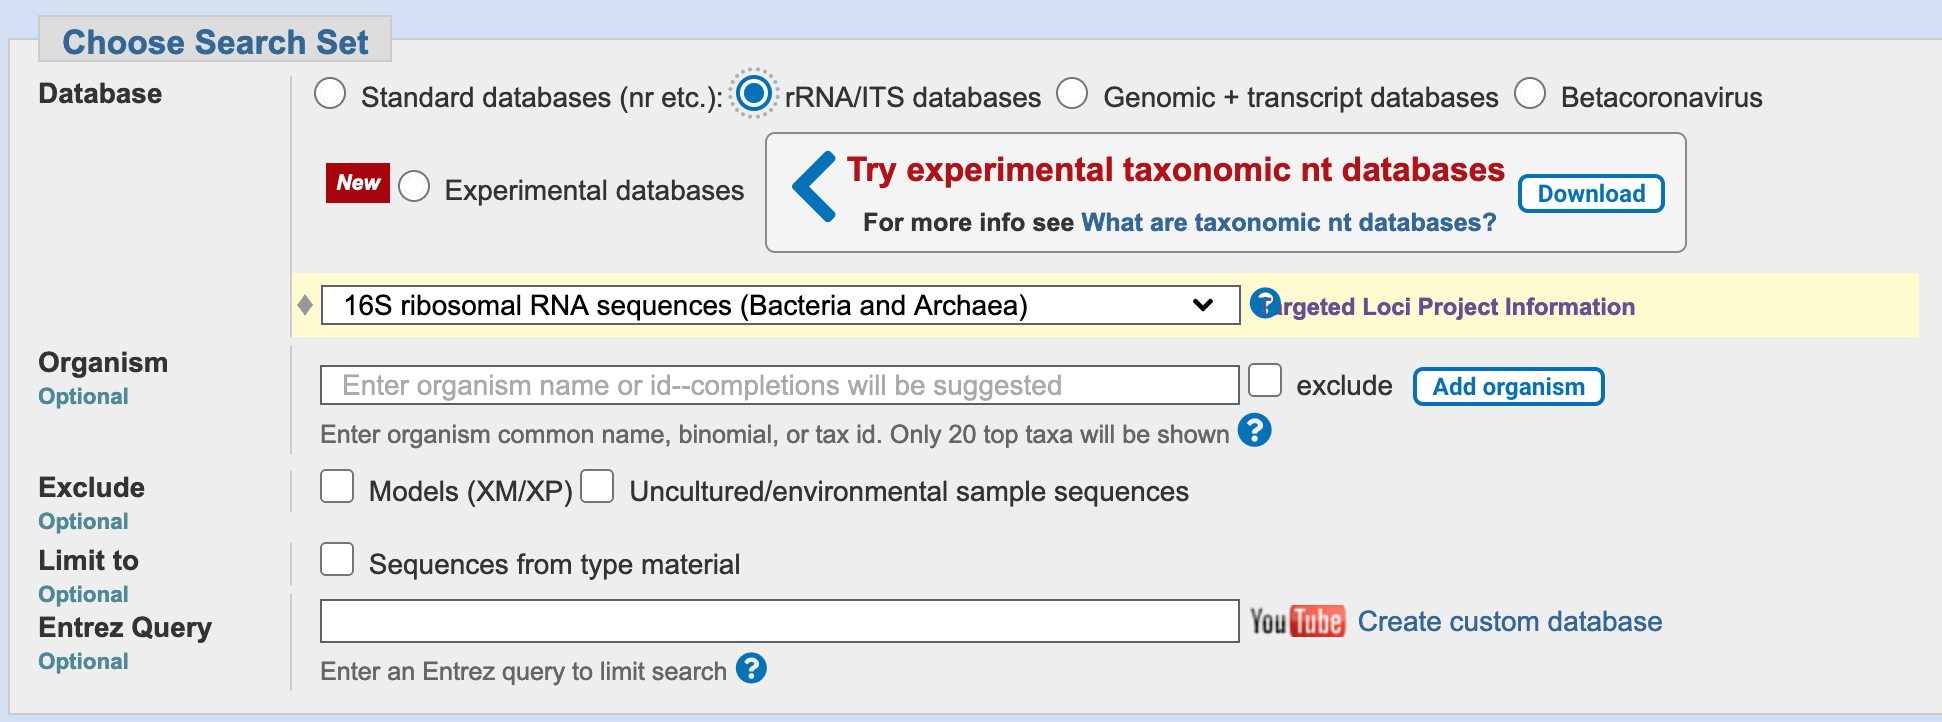
You have a well-defined set of target sequences that you want to compare your query with: they are all 16S sequences. Can you see a database on the search page that might be suitable?
The NCBI BLAST webservice provides specialised databases for common, well-defined search tasks, including searching for 16S or ITS (Internally-Transcribed Spacer) sequences when identifying unknown microorganisms.
Select the rRNA/ITS databases radio button, and ensure that the “Bacteria and Archaea” database is selected.
4.2.5 Run the BLAST search
BLAST search
Click on the BLAST button.

BLAST button
4.2.6 Interpret the BLAST report (MyPlace Questions)
It is common for 16S rDNA sequences to match many other bacterial sequences in the database. However, by identifying those most closely-related to the query sequence, you should be able to establish a likely identity for this organism.
Please answer the questions below in the formative quiz on MyPlace
Clicking on the green box should give you a hint to the answer, or where to find it.
Check the Accession column under “Sequences producing significant alignments” in the report’s Descriptions tab.
Check the Description column under “Sequences producing significant alignments” in the report’s Descriptions tab.
Check the Total Score column under “Sequences producing significant alignments” in the report’s Descriptions tab.
Check the Query Cover column under “Sequences producing significant alignments” in the report’s Descriptions tab.
Check the Per. Ident column under “Sequences producing significant alignments” in the report’s Descriptions tab.
Click on the accession number for the best match. This will open a new tab in your browser with the gene record.
The gene record contains an annotation field called /product that can be found just above the sequence data. If you cannot see it, search for /product in the page.
If it is not already open, click on the accession number for the best match. This will open a new tab in your browser with the gene record.
The gene record contains an annotation field called /geo_loc_name that can be found just above the sequence data. If you cannot see it, search for /geo_loc_name in the page.
If it is not already open, click on the accession number for the best match. This will open a new tab in your browser with the gene record.
The gene record contains an annotation field called /isolation_source that can be found just above the sequence data. If you cannot see it, search for /isolation_source in the page.
Look down the list of results under “Sequences producing significant alignments” until you find an organism that is not the same species as the best match to your query.
Check the Accession column.
Check the Total Score column.
Check the Query Cover column.
Check the Per. Ident column.
Click on the accession number for this match. This will open a new tab in your browser with the gene record.
The gene record contains an annotation field called /product that can be found just above the sequence data. If you cannot see it, search for /product in the page.
If it is not already open, click on the accession number for this match. This will open a new tab in your browser with the gene record.
There is no annotation field called /country that can be found just above the sequence data, but check the TITLE field for the associated publication.
If it is not already open, click on the accession number for this match. This will open a new tab in your browser with the gene record.
There is no annotation field called /isolation_source in this case, but check the TITLE field for the associated publication.
4.3 Stretch Activities
These activities are not necessary for the assessment, but provide more information relevant to interpreting your BLAST results. Open the orange boxes to see the questions, and use the green boxes to find some answers.
4.3.1 Inspect the matching sequence alignments
Alignments tab in the report
The Alignments tab shows the pairwise sequence alignments for each match BLAST has found for your query sequence. Some questions to consider:
- How does the information in each pairwise alignment header relate to the table of results in the
Descriptionstab? What extra information about the alignment can you find here, under this tab? - Scroll down the list of pairwise alignments. Do you notice any patterns in the alignments - specifically, do you see any regions where disagreement between the
QueryandSbjectsequences seems to be more common? Hint: try to find position 356 in the query sequence
Alignments
- The pairwise alignment headers give additional information, such as the numbers of identities and gaps, not just overall percentages. The alignments themselves are visible, which gives precise information about which bases differ between sequences.
- There are regions where all the matched sequences seem to be similar, and regions where they all seem to vary. The region around position 356 in the query looks to be associated with an insertion in many of the matches.
MSA viewer link in the report
The MSA viewer link will open a new tab containing a multiple sequence alignment of the matches to your sequence, showing differences in the matching sequences. Red marks indicate a base substitution, blue marks indicate an insertion relative to the query. You can use the zoom tool to zoom in and see individual base differences.
Some questions to consider:
- Are the results in the tree consistent with the results in the
Descriptionstab? Is there any extra information here that is not found in theDescriptionstab? - Do the sequences from the best match to your query differ in the sequence alignment? Where do they differ?
- Are there clear patterns of sequence conservation (grey) and variation (red/blue)? Do these look similar to the patterns you saw in the pairwise sequence alignments?
- Look at position 356 in the query sequence. How do most of the matches differ from the query here? Do the best matches differ from the query at this position in the same way?
MSA viewer
- Yes, they are consistent. The alignment gives information about the location and nature of sequence differences between the query and each match.
- Yes, the best match sequences differ, at a number of regions throughout the sequence length.
- Yes, there are clear patterns of conservation and variation. It was difficult to spot these with the pairwise sequence alignments.
- Most matches that are not the best-match organism have an insertion here.
4.3.2 Inspect the graphic summary
Graphic Summary tab in the report
The Graphic Summary tab shows a visual representation of the pairwise sequence alignments for each match BLAST has found for your query sequence. Some questions to consider:
- Do all the subject sequences align to the same location on the query sequence?
- If the subject sequences do not all align to the same locations, are there any regions of the query sequence to which they all consistently align?
- Did you see any gaps in the pairwise alignments when you examined the results under the
Alignmentstab? If you did, can you see them in theGraphic Summary?
Graphic Summary
- No.
- All the matches appear to align to a core region spanning most of the centre of the query sequence.
- Any gaps don’t seem to be visible - the lines indicating matches are continuous.
4.3.3 Inspect the match taxonomy
Taxonomy tab in the report
The Taxonomy tab summarises the taxonomic assignments for each match BLAST has found for your query sequence. Some questions to consider:
- Are the results in the
Lineagetab consistent with the results in theDescriptionstab? Is there any extra information here that is not found in theDescriptionstab?
Taxonomy
- Yes they are consistent, and the total count of matches to each individual taxon is given.
Distance tree of results link in the report
The Distance tree of results link will open a new tab containing a phylogenetic tree, showing the placement of your sequence in relation to the matching sequences. Some questions to consider:
- Are the results in the tree consistent with the results in the
Descriptionstab? Is there any extra information here that is not found in theDescriptionstab? - Do you think it is equally likely that your organism is related to the best match, as it is to the next most similar organism’s sequence that you found?
Distance tree
- Yes, they are consistent. The tree gives us evolutionary information about the order of divergence of each organism’s sequences, when they diverged, and also which organisms’ sequences are more similar to each other.
- The best match organism appears to be distinct from (diverged separately from) the next-best matching organism, so the query looks to be more related to the best match’s taxon than to that of the next-best match.
4.4 Summary
After successfully working through this scenario, you should be able to
- propose a taxonomic identity for an unknown organism by identifying its likely relatives from a 16S sequence
- interpret the main output from a
BLASTsearch at NCBI - be able to use NCBI
BLASTsearch output to find and use additional information about matching sequences
If you completed the stretch activities you should be able to
- use the graphic summary to interpret the similarities between the query sequence and the matches reported by
BLAST - find and explain the
BLASTresult’s multiple sequence alignment - find and explain the
BLASTresult’s distance tree and taxonomy information, and use it to understand the relationships between the matching sequences