Yeast Growth Experiment
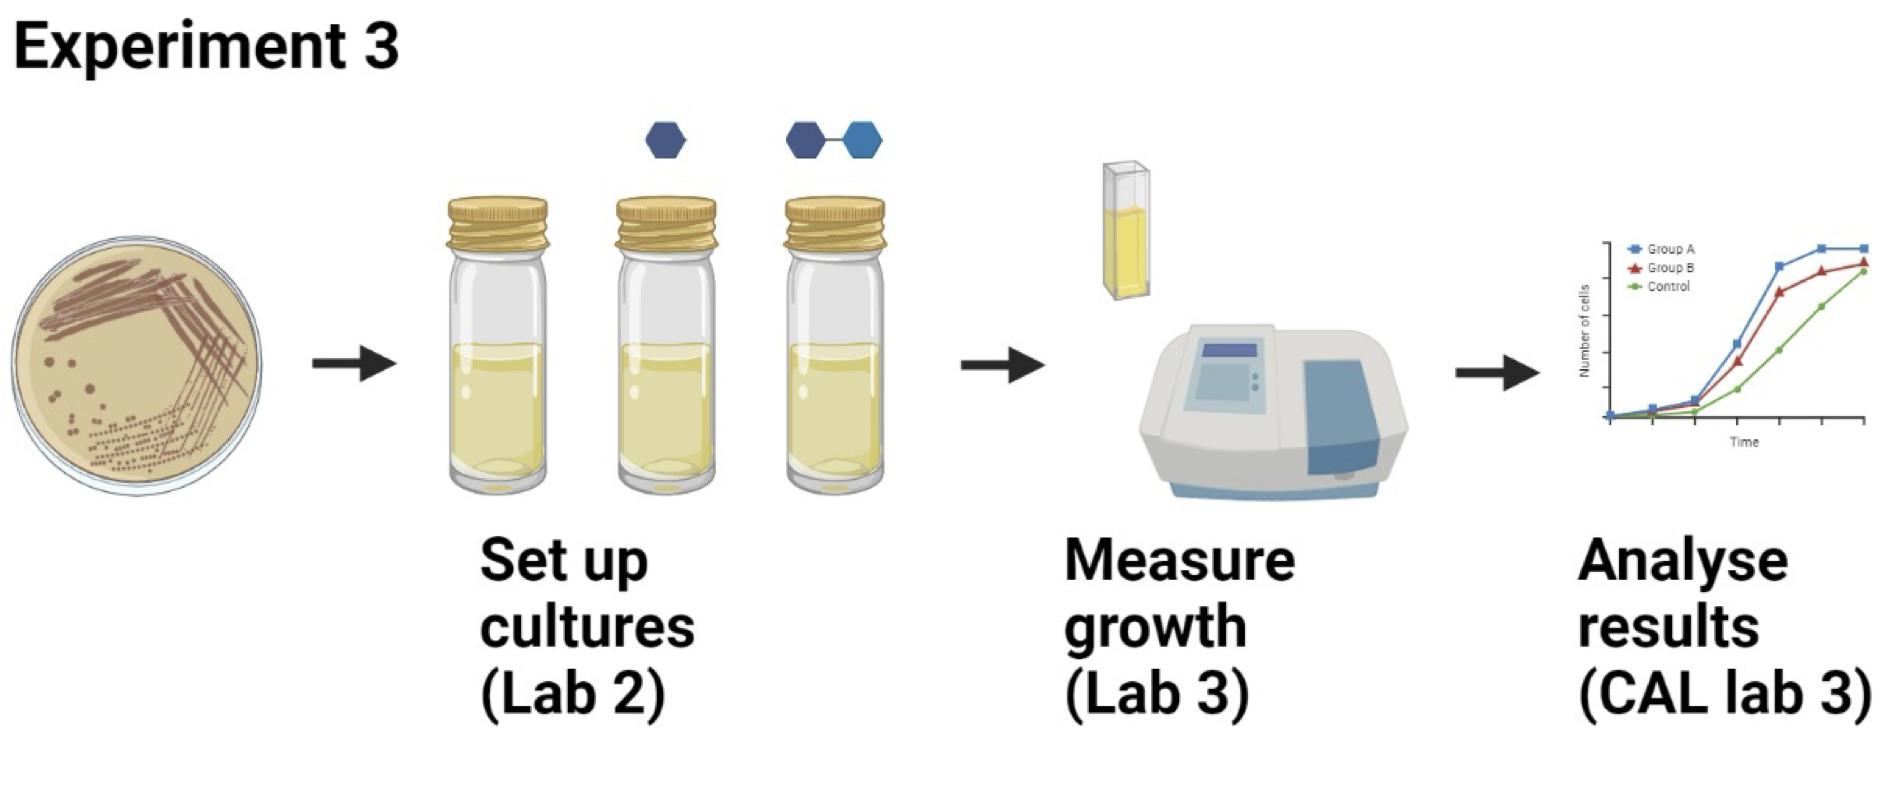
As part of BM214 laboratories 2 and 3 (Figure 1) you investigated strains of Saccharomyces cerevisiae that had been generated by random mutagenesis. In laboratory 2, you were provided with streak plates containing S. cerevisiae strains, and set up cultures in liquid media:
- control
- supplemented with glucose
- supplemented with lactose
These cultures were incubated for you, and in Laboratory 3 you measured their growth using a spectrophotometer.
In this part of the workshop, you will use R to plot growth curves for your strains interactively, in the browser.
You have met R before in the statistics component of BM110, and in an interactive exercise as part of a BM211 workshop.
R can be used in several different ways - as a standalone program, within the RStudio environment or - as here - in a web browser. Full instructions for how to generate your figures are provided as part of the workshop.
When you have completed the exercise, please answer the questions below in the formative quiz on MyPlace