6 Inspect Read Quality
Using good quality input data improves our chance of getting a good quality output assembly.
We call the set of sequenced reads we obtain from the sequencer the raw reads. Modern sequencing technologies usually give us high quality data, but it is still possible for some low-quality read sequences to be produced among the raw reads. So that these do not detrimentally affect the quality of our assembly, we first assess the quality of our read data, and then remove low-quality reads and low-quality parts of read sequences. The resulting dataset is often called the cleaned reads or processed reads.
It is good practice always to inspect the quality of your sequencing read data, and remove low-quality reads, before assembly.
When describing your sequencing experiment in a manuscript or dissertation, you should always state:
- The sequencing technology used, and the sequencing platform
- The number of raw reads obtained, and a measure of average read length
The main kinds of low-quality data we might have in our raw reads are:
- Contamination: reads that derive from an organism we didn’t intend to sequence; these are usually identified by querying against a database and subsequently removed
- Low-confidence basecalls: reads containing base calls that the basecaller is unsure about; these are usually found towards the end of the read sequence and are removed by trimming the read
- Low-confidence reads: reads where a large proportion of the base calls are low quality; these are usually removed
- Adapter sequence: these are sections of sequence left over from library preparation and do not derive from the sequenced organism; they are removed by trimming
This part of the workshop will cover the use of Falco to inspect the quality of your sequence reads.
6.1 Using Falco
- Navigate to the
Falcotool using theToolssidebar inGalaxy
- You can use the
search toolsfield to findFalco - Alternatively, you will find it under
GENOMIC FILE MANIPULATION/FASTA/FASTQin the sidebar
- Select the
Falcotool - Run the
Falcotool on each of yourFASTQinput files
- These are the
ERR531380_1.fastqandERR531380_2.fastqfiles. - With the
Falcotool options in the mainWorkspacewindow, select the file you want to runFalcoon. - Click on the
Run Toolbutton.
Make sure you run Falco on both the forward and reverse read sets.
Falco to assess the quality of your sequencing reads
Falco takes a few moments to run (but is faster than FastQC, which it has superseded.
When the run is complete, click on the eye icon of the Webpage result to inspect the FastQC output.
You can press and hold CTRL (on a PC) or CMD (⌘, macOS) when clicking the eye icon to open the result in its own window.
6.2 Falco output
The output of Falco tells us a lot about the quality of our sequencing data, and we would typically use it to identify problems with our sequencing data. Some important sections are described below, and you can read more about how to diagnose quality issues in your dataset at the links below:
Falco and FastQC
Falco is a reimplementation of the FastQC application. Almost all of the documentation about use and interpretation of FastQC also applies to Falco.
Falco output in Galaxy
6.2.1 Falco Summary
The Falco summary (Figure 6.1) provides an overview that indicates where there may be areas of concern in your data. Each section of the report receives a flag indicating either that it gets a pass (green), a warning (amber), or a fail (red) mark.
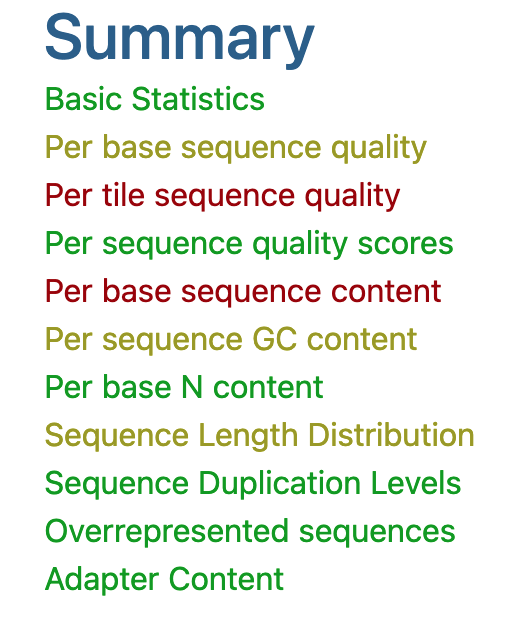
Falco summary showing passes for most sections of the report including “Basic Statistics,” warnings for some sections including “Sequence Length Distribution,” and a fail for “Per tile sequence quality”
6.2.2 Per base sequence quality
The per base sequence quality plot (Figure 6.2) presents the ranges of individual base quality calls across the lengths of the input sequence reads. Higher scores (near 40) indicate better quality.
For good-quality sequence read data, we are looking for a graph where the mean quality (see Figure 6.2) is always showing green, with a score greater than 29.
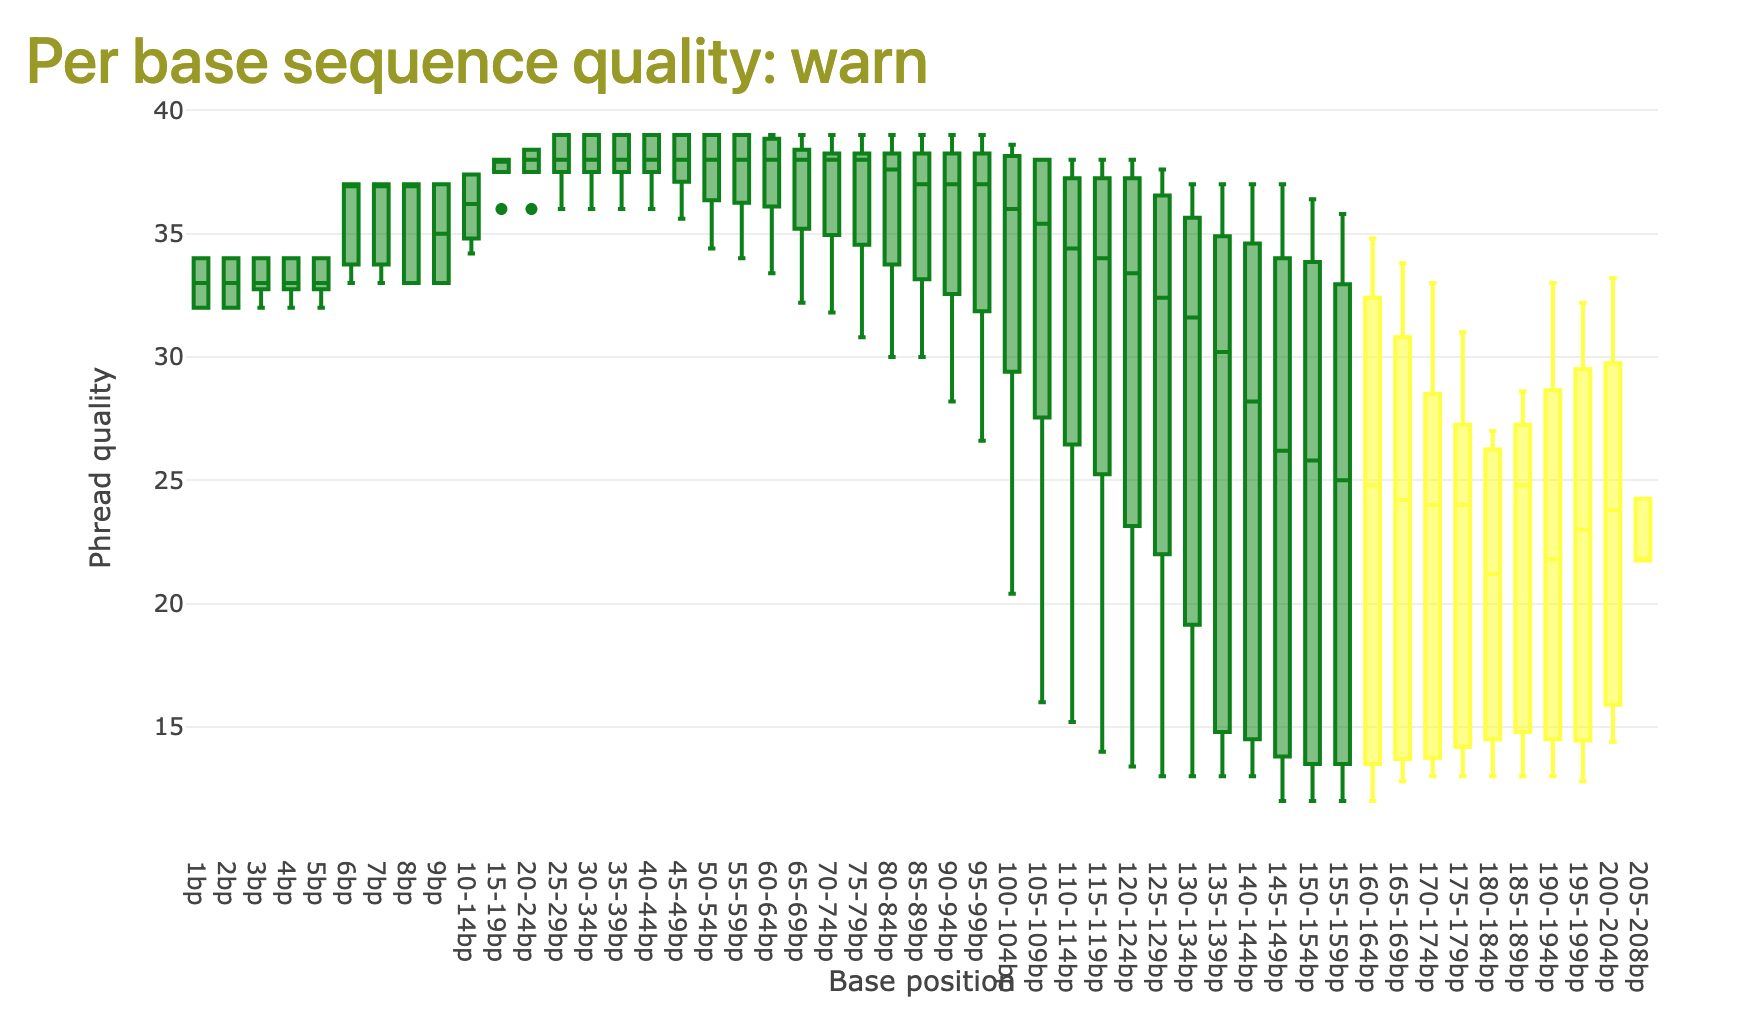
Falco indicating high quality sequencing reads. Quality score ranges are presented as a boxplot at each sequence position range. In this example, quality is high for the first 100 bases, but dips significantly and becomes less reliable at about 150 bases into the reads.
It is not unusual for the per-base quality scores to fall quite steeply towards the end of the reads, with Illumina and other sequencing technologies.
It is also typical for the quality score to be slightly lower in the first 5-7 bases of the read.
If mean quality per base falls below 29, there may be a problem with the sequencing data.
6.2.3 Per sequence quality scores
The per sequence quality score (Figure 6.3) summarises the distribution of high quality (higher scores, near 40) and lower quality reads in the complete dataset.
In good quality sequence data, we tend to see a sharp peak towards the right hand side of the plot.
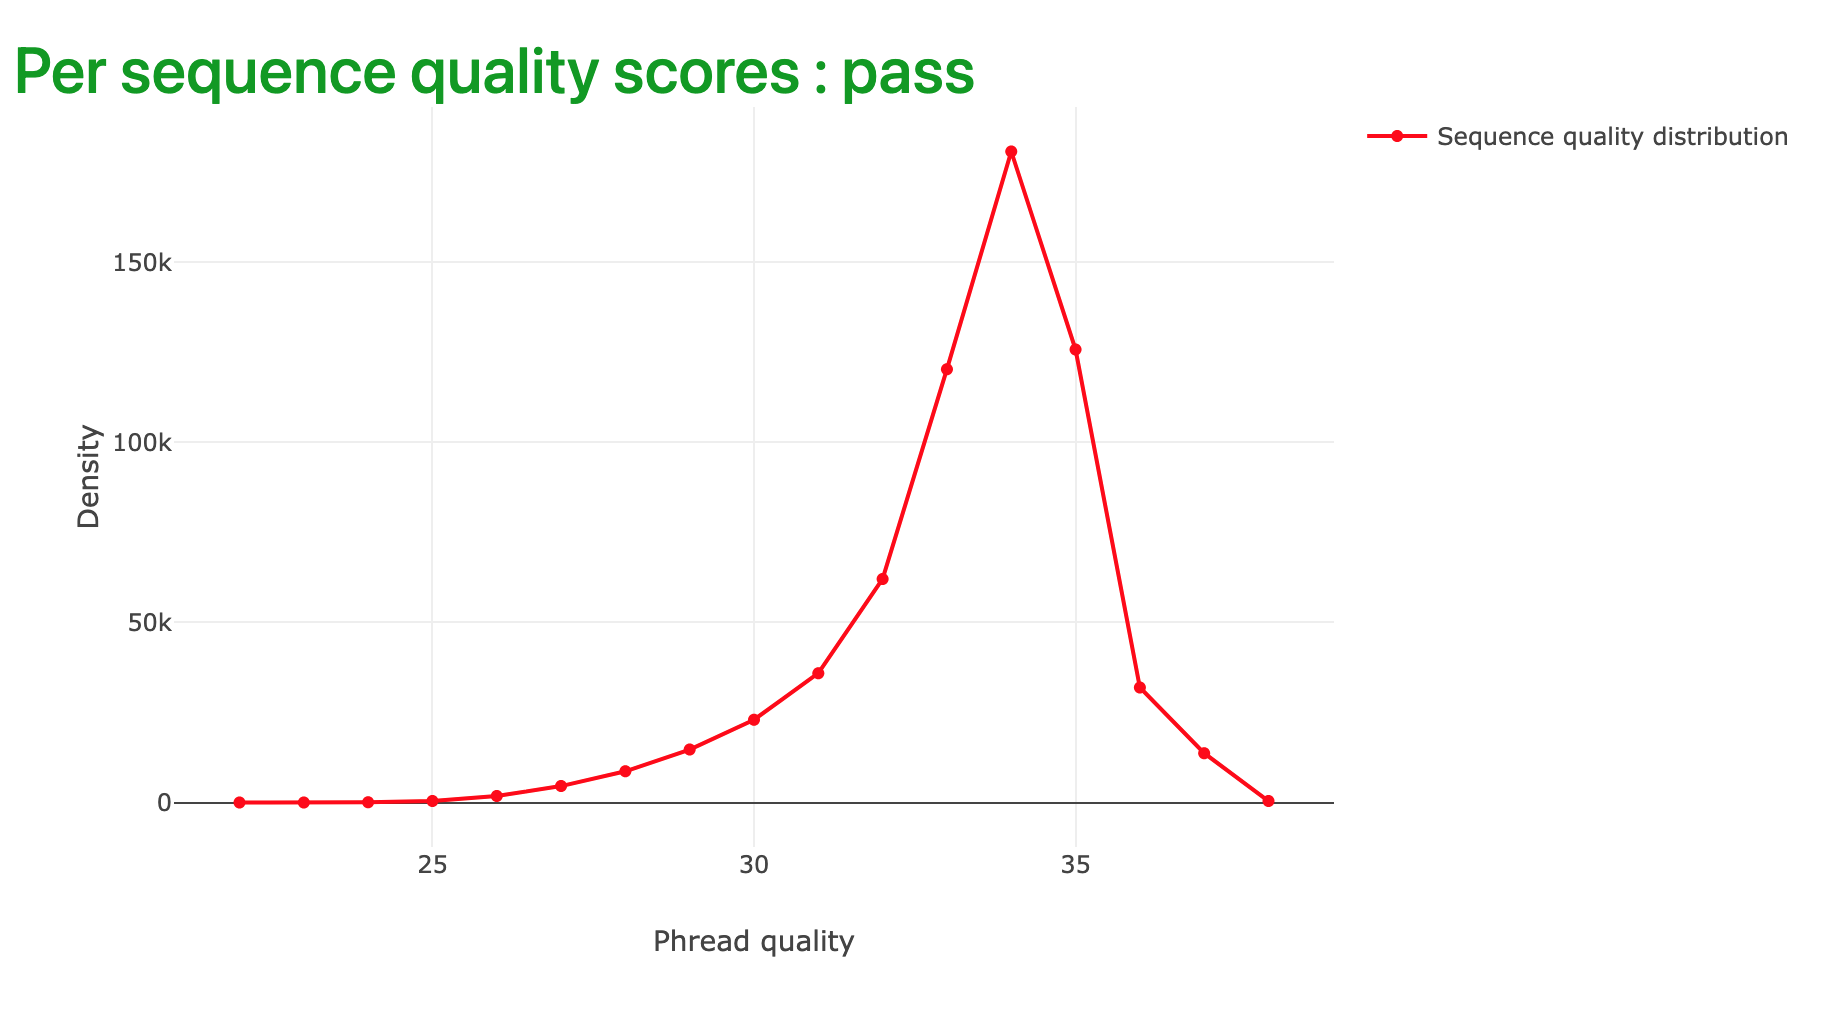
Falco indicating a majority of high quality sequencing reads. The tail to the left is quite “heavy” suggesting that there are quite a few lower quality reads in this dataset.
If the per sequence quality score appears flat, or plateaus towards the left hand side of the plot, there may be a problem with the sequencing data.
6.3 Inspect the Falco output
What issues, if any, do you see in each read dataset?
6.4 What do we do about sequencing data problems?
Falco does a great job of alerting us to problems with our sequencing data sets. But, by itself, it cannot remedy these problems.
Modern sequencing methods produce so much read data that the usual approach to excluding poor data is either to exclude (or drop) the read itself, or to trim (throw away) the section of the read sequence that is low quality.
A popular tool for removing poor quality read data is trimmomatic and you will meet this in Chapter 7.