14 Visualising the Phylogenetic Tree
In this section you will use the online tool iTOL (Letunic and Bork (2021)) to visualise the phylogenetic tree you created in Chapter 13. This tree represents evolutionary relationships between the 33 study isolates (and a reference), as inferred from differences in their genome sequences. By appropriately rooting1 and annotating the tree, you should be able to draw conclusions concerning the routes of transmission of these isolates.
14.1 Downloading the tree
To use iTOL you need to upload a file representing the phylogenetic tree. At the moment your tree file only exists on Galaxy so you need to download it to your local project folder. To download the tree file:
- Click on the
Best-scoring ML Treehistory item - Click on the floppy disk icon2
- Select the appropriate location to download the file
- Click
Save
This will place the Newick-formatted tree file in your local directory.
NoteVideo: Downloading the tree file
14.2 Upload the tree to iTOL
- Navigate to the
iTOLwebsite at https://itol.embl.de/ - Click on
Upload a tree - Click on
Browseand navigate to your downloaded Newick tree file - Select the tree file and click
Open. The tree file’s name should appear at theiTOLsite - Click
Upload
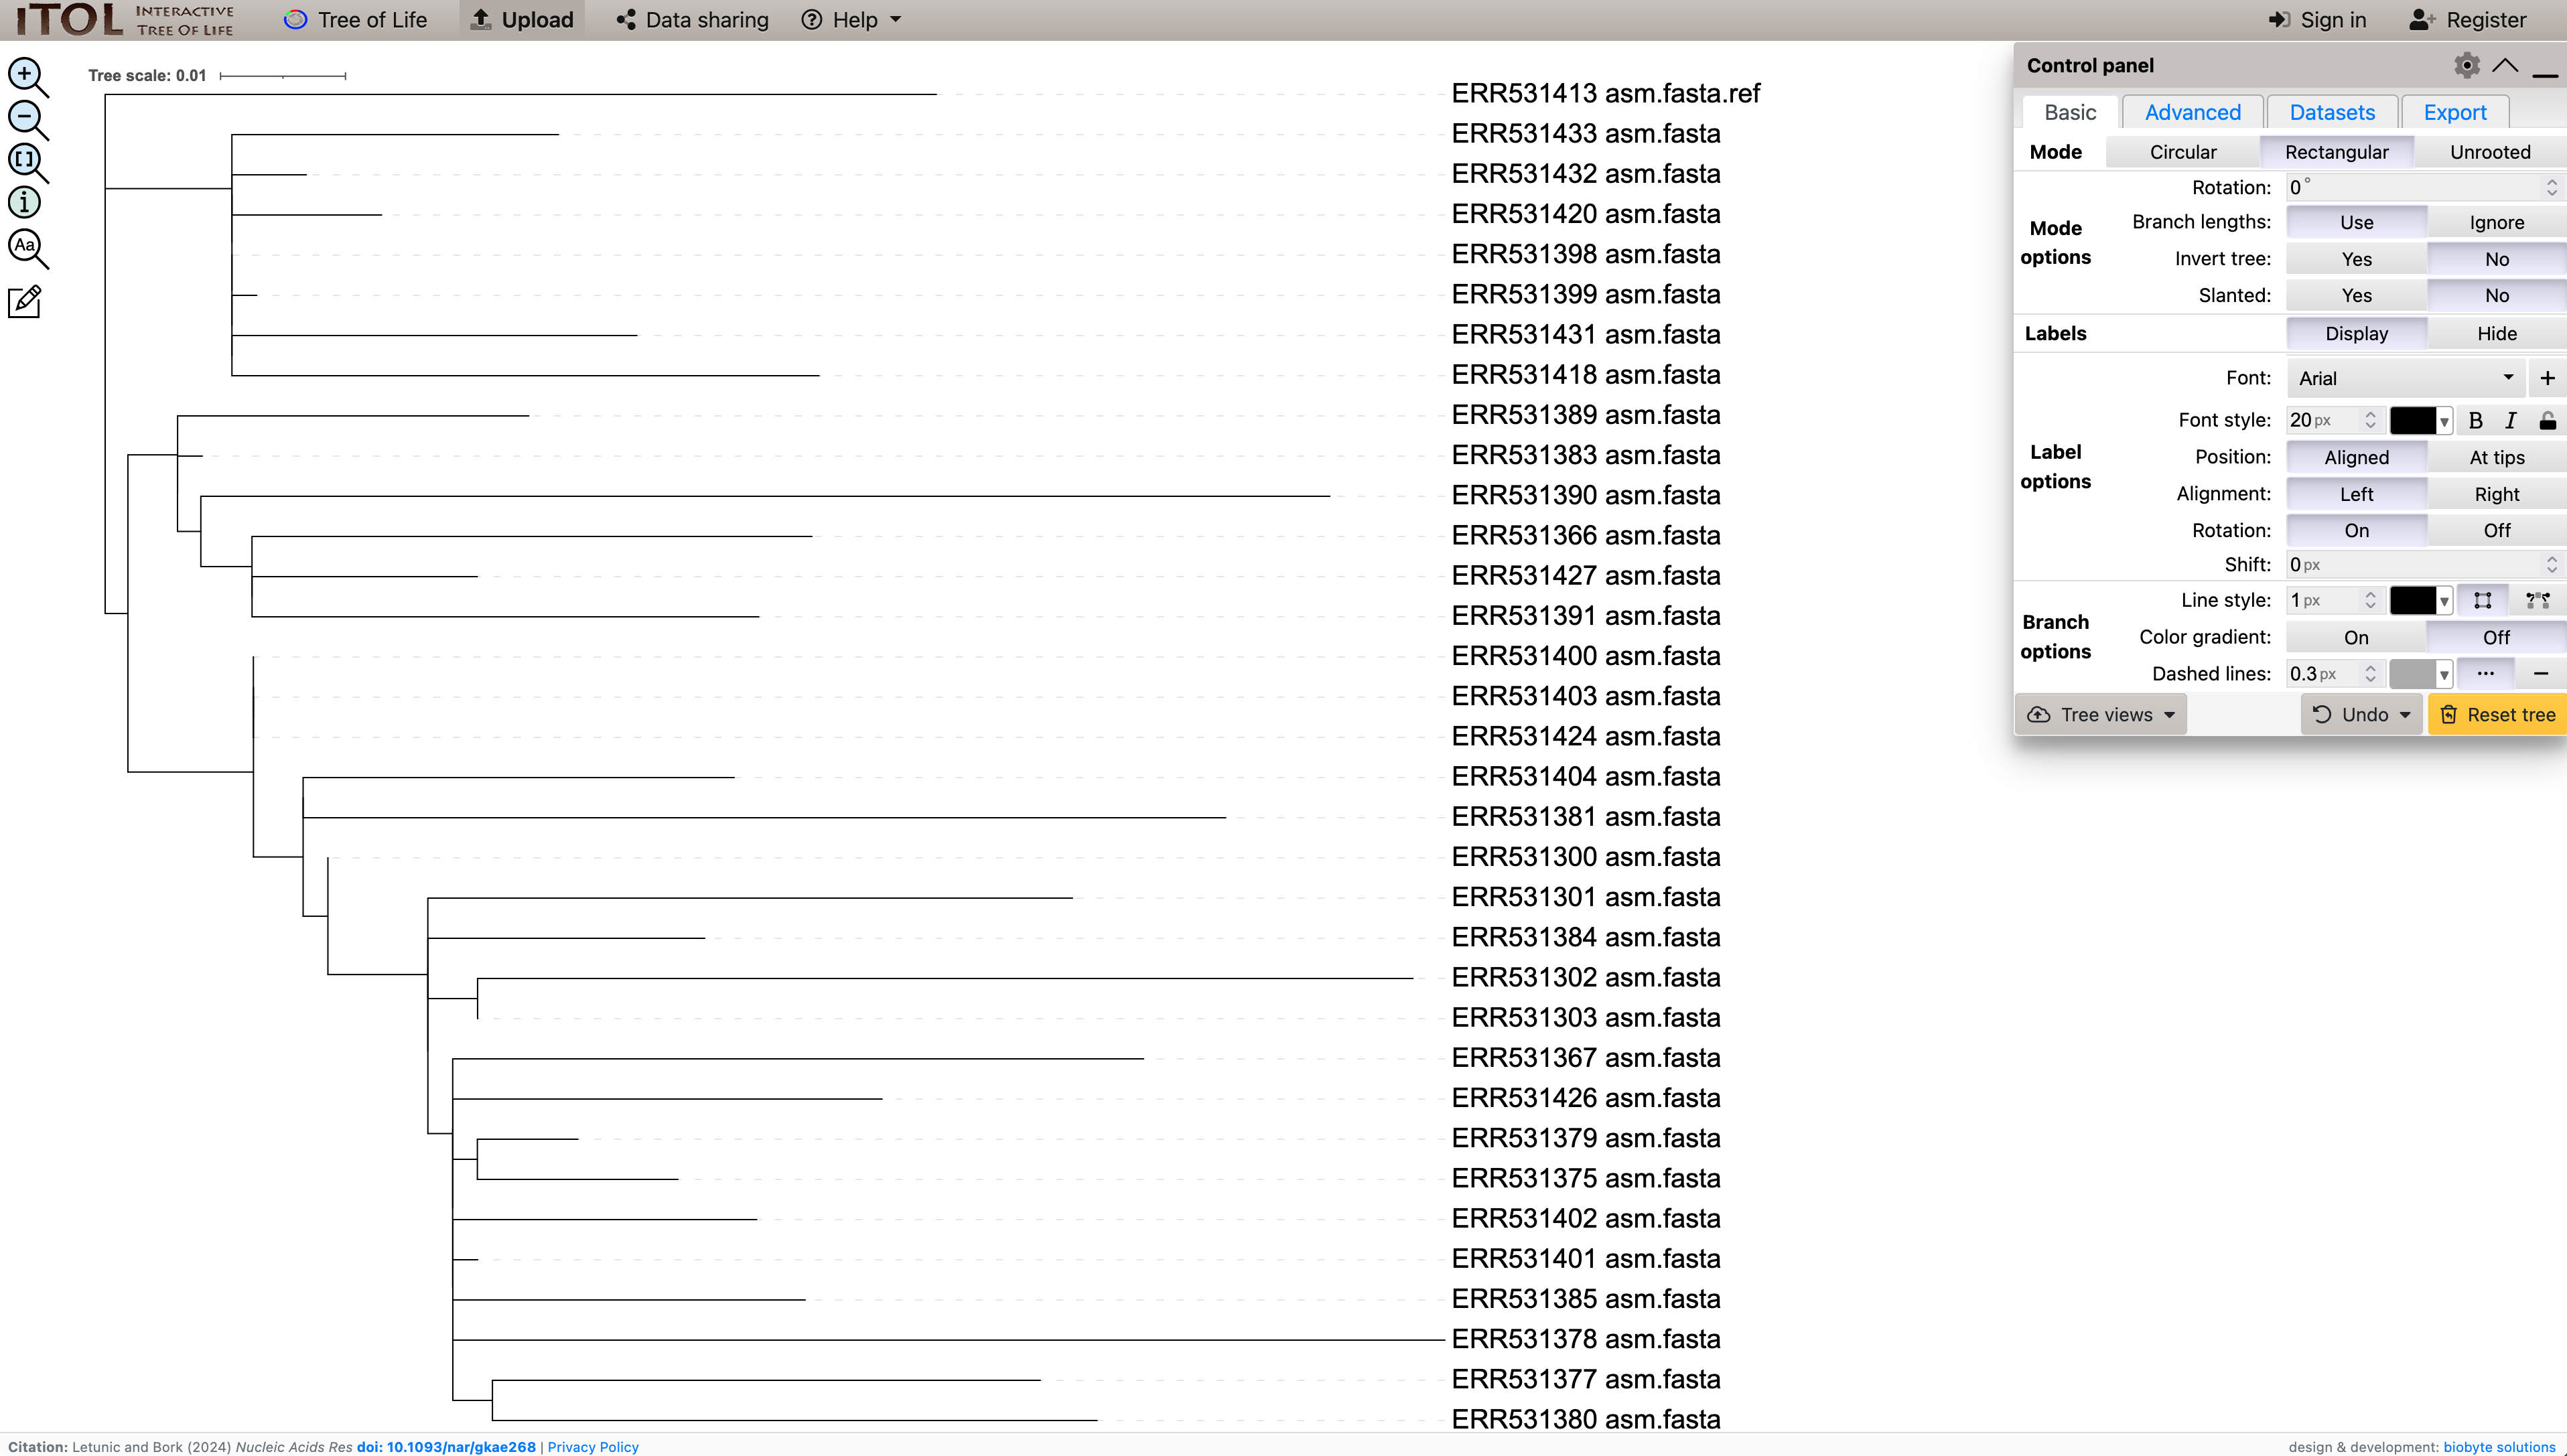
A basic representation of your tree should appear, as in Figure 14.1
iTOL
NoteVideo: Upload the tree file to
iTOL
14.3 Re-rooting the tree
Important
Your colleague has been super-helpful and identified the reference genome that is assumed to be ancestral to all of the genomes in the tree. The ancestral genome, which should be considered the root of the tree, is ERR531413_asm.fasta.ref. Rooting the tree at this genome should make the tree reflect the time sequence of divergence of each isolate from their common ancestors.
- Click on the ancestral node in the tree:
ERR531413_asm.fasta.ref - Click on
Tree structure -> Re-root the tree here
NoteVideo: Re-root the tree to the known ancestral reference
Tip
As a reminder, and to help with tree annotation, the interactive table of isolate metadata is shown below in Table 14.1.
Callout-questionsQUESTIONS
Your rooted tree has an implied structure to it. Branching events proceed in order from assumed to be oldest to assumed to be most recent, from left to right. This has resulted in some visible clustering of sequences into groups that appear to share a more recent common ancestor to each other than to other sequences in the tree. We call these groups monophyletic clades as they share a single common ancestor, or just “clades” for short.
- Using Table 14.1, what feature of the data appears to be common between the sequences in the clade of seven sequences including
ERR43133andERR531418? - What other clades do you see, and what features do they seem to have in common?
14.4 Annotating the tree
We are interested in how P. aeruginosa may have spread around the burns ward. We can gain some insight into this by annotating the phylogenetic tree, which represents the evolutionary history of the isolates, with metadata. For example, annotating the tree with the bed number might help us understand whether the isolates tend to stay in one location, or whether they move freely between beds. Similarly, annotating the specimen type can help us understand if there is transmission between patients, from environment or water to the patient, or from the patient to the environment.
Tip
It can help visibility to increase the linewidth for all branches in the tree.
To do this, look for Branch options in the Basic iTOL tab of the control panel. There is an option called Line style. Click on the chevrons to obtain a branch line weight that is pleasing to the eye.
14.4.1 Relabel branches to indicate the beds they were sampled from
- Sort Table 14.1 by bed number by clicking on one of the triangles next to the
Bedheader - Identify the branches corresponding to the genomes sampled from bed 6
- Modify the label for each branch to indicate the bed it was sampled from (e.g. change
ERR531398_asm.fastatoERR531398_bed6)
- Click on the branch label
- Click on
Label -> Text -> Edit label - Enter the new label
- Click on the tick (changes won’t be saved if you do not do this)
- Repeat steps 2 and 3 for the genomes sampled from beds 9 and 11
NoteVideo: Relabel branches to reflect the beds they were sampled from
14.4.2 Change label colour to indicate the specimen type
- Sort Table 15.1 by bed number by clicking on one of the triangles next to the
SpecimenTypeheader - Identify the branches corresponding to the
Environmentalsamples - Modify the background colour for each of these branches to be the same colour (e.g. green)
- Click on the branch label
- Click on
Label -> Text -> Edit label - Enter the new label
- Click on the tick (changes won’t be saved if you do not do this)
- Repeat steps 2 and 3 for the Patient and Water samples, using contrasting colours
NoteVideo: Colour branch labels to indicate the sample source
14.4.3 Relabel branches to indicate the patients from which they were sampled
- Sort Table 15.1 by patient by clicking on one of the triangles next to the
PatientIDheader - Identify branches with a
SpecimenTypeof Patient - Update the label for each such branch to indicate the patient corresponding to the sample (e.g. change
ERR531300 bed 11toERR531300 bed 11 P01)
NoteVideo: Colour branch labels to indicate the sample source
14.5 Next Steps
Now that you have reconstructed a phylogenetic tree and annotated it with metadata for each sequenced isolate, you can move on to interpreting the data in Chapter 15.
Maximum likelihood methods produce unrooted trees, which means that they don’t make a decision on which of the branching points is the oldest. Rooting a tree is essentially a visual improvement where we use other information about what we believe to be the most ancient branching event to modify our view of the tree, making it appear that branching events proceed in the order that they actually happened.↩︎
We know you’re all too young to have used a floppy disk, but humour us…↩︎