10 Find Sequence Variants
snippy is a sequence variant finding pipeline, designed for haploid genomes such as prokaryotes and viruses. It uses BWA-MEM to align reads to the reference genome, but it also performs a number of filtering and statistical steps to improve the quality of SNP identification.
As with most kinds of bioinformatics data, there is a data format designed specifically to capture the important elements of the data, and snippy outputs its results in this format (called VCF) as well as in a data table.
When reporting how you identified variants for your manuscript or dissertation, you should always state:
- The software tool you used, with its version number and a citation of the paper describing it (if available; provide a URL to the software if there is no paper)
- The parameters used when running the tool (if default parameters were used, state this)
10.1 Using snippy
- Navigate to the
snippytool - Select
snippy - Select
Use a genome from history and build indexfromWill you select a reference genome… - Choose the
GCF_000006765.1_ASM676v1_genomic.fnafile inUse the following dataset as the reference sequence - Select
PairedunderSingle or Paired-end reads - Choose the cleaned post-
trimmomatic(R1 paired)data for the forward reads - Choose the cleaned post-
trimmomatic(R2 paired)data for the reverse reads - Click
Run Tool
snippy
snippy can take a few minutes to run to completion.
10.2 snippy Output
snippy provides output in .vcf format, which is designed to be processed by bioinformatics software and is not the most understandable form for humans. To see the snippy output in a more human-readable form, click on the eye icon for the snps table output (Figure 10.1).
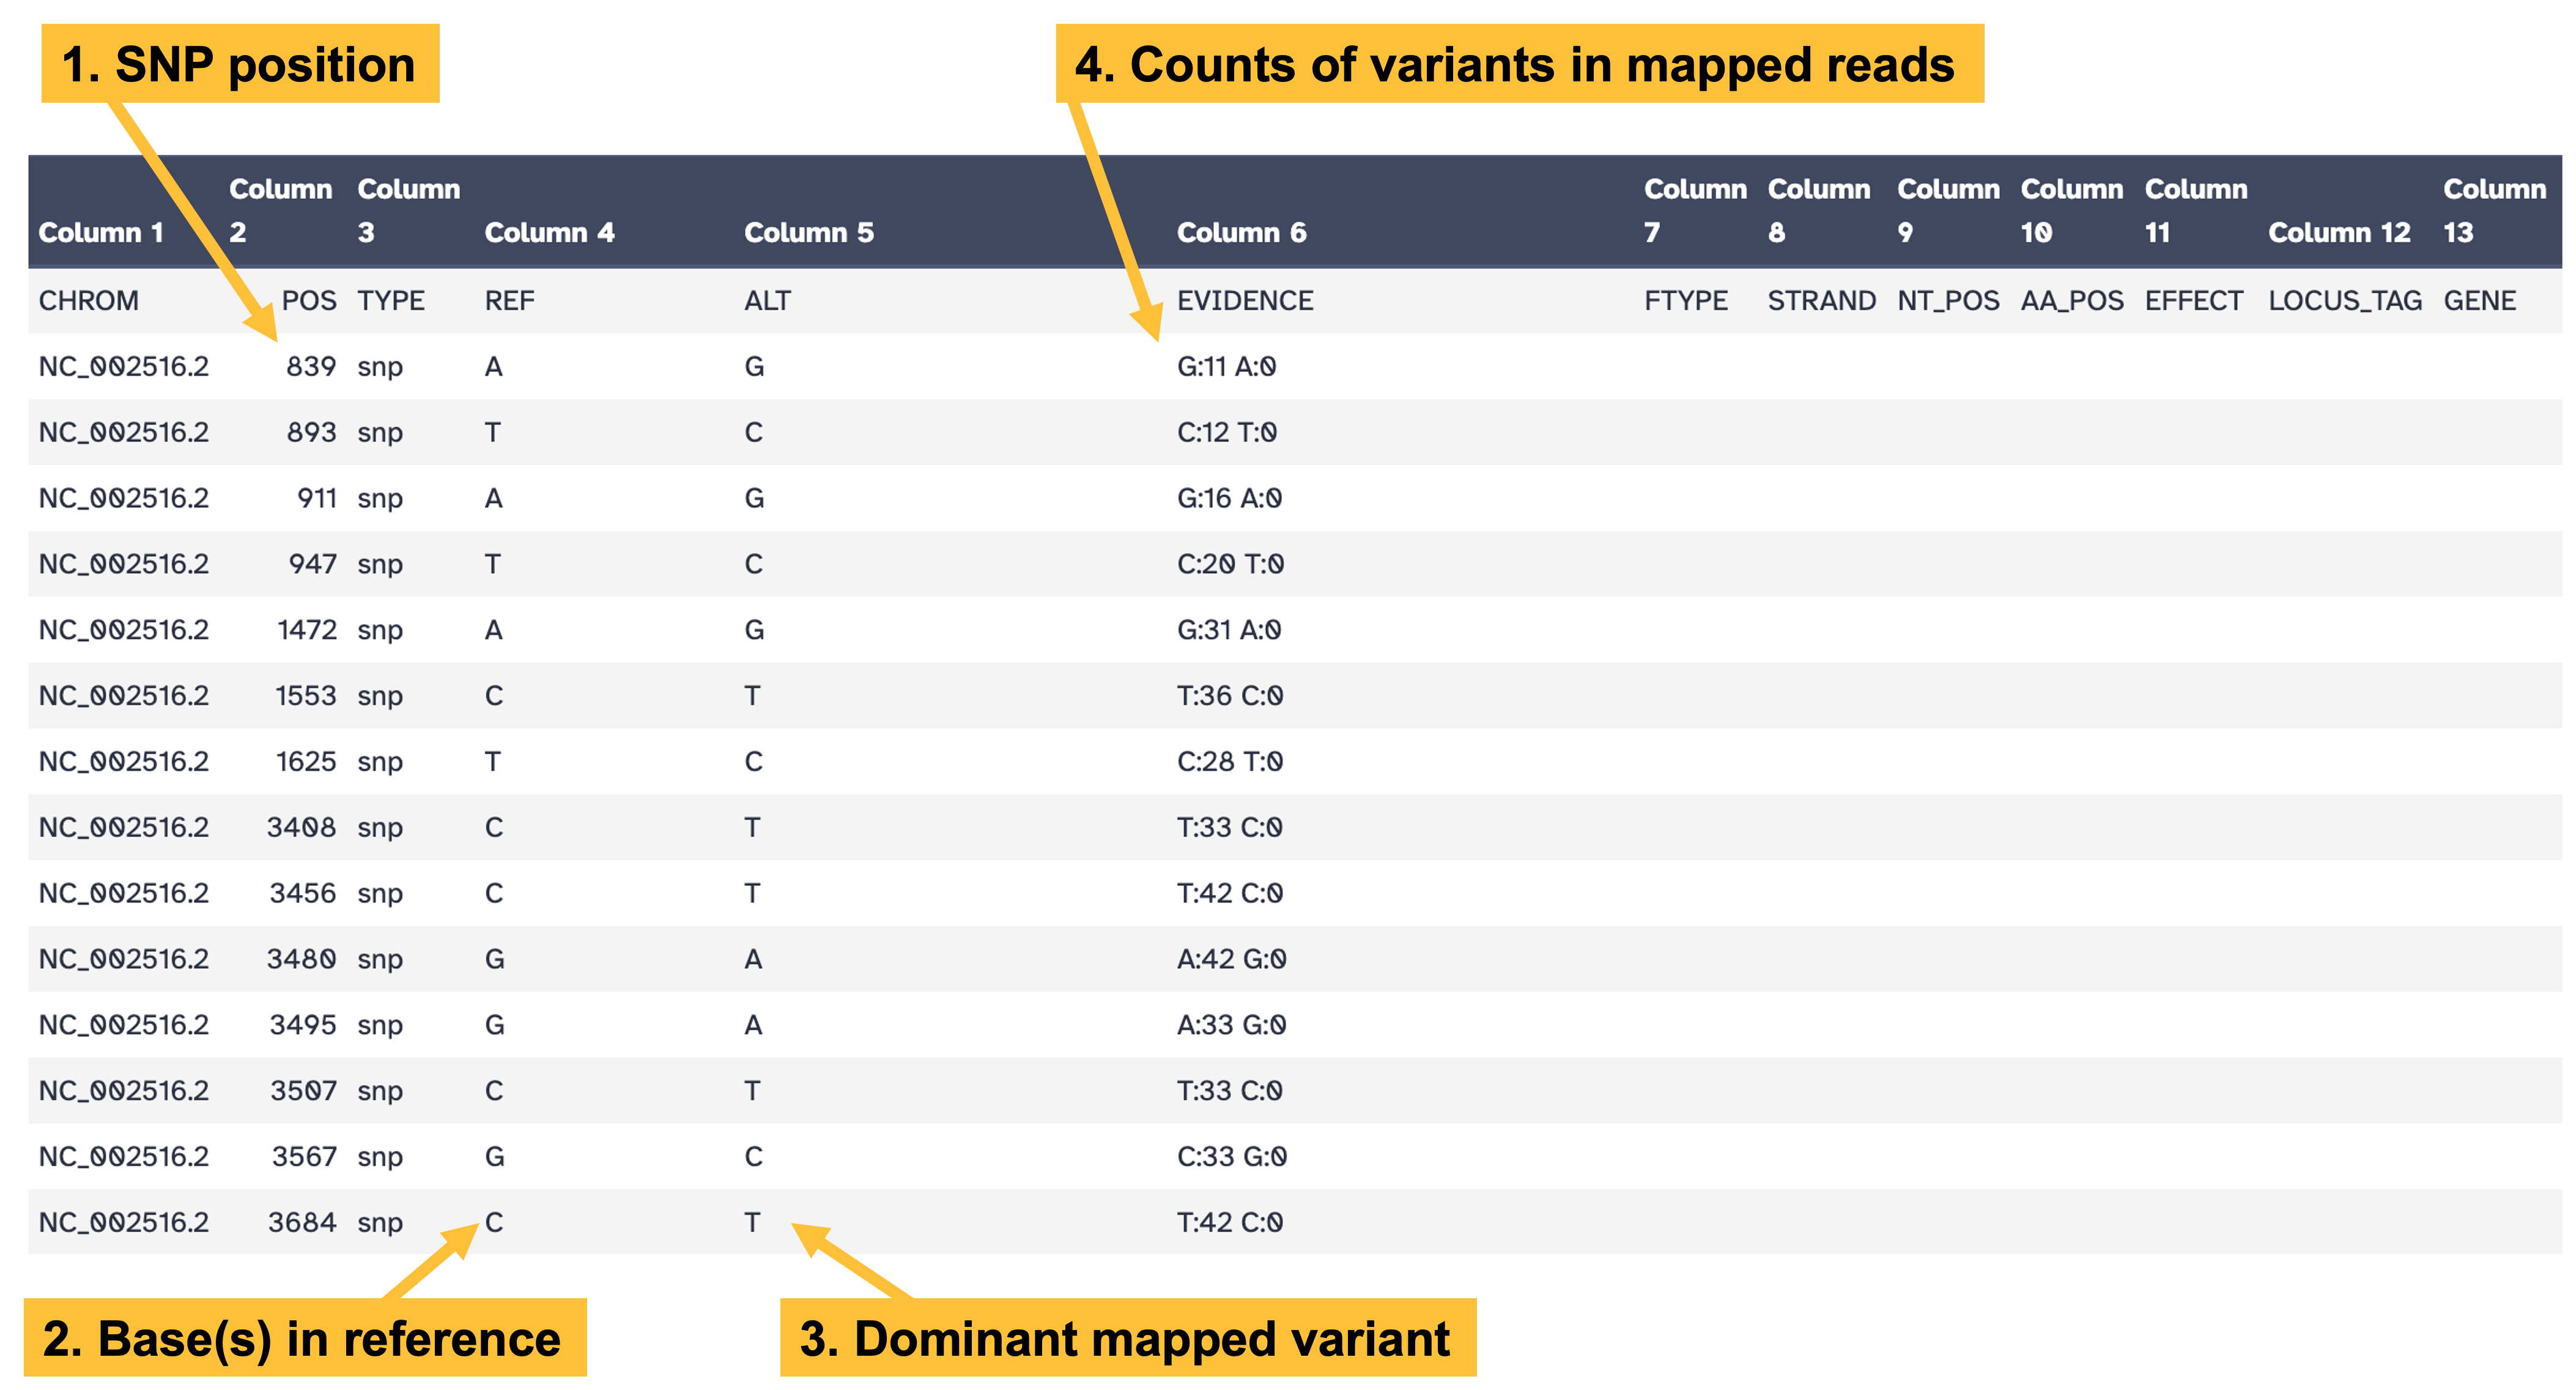
snippy snps table output. Key columns in the output are: column 2, indicating the position of the variant; column 4, indicating the reference base(s); column 5, indicating the dominant variant in the mapped data; and column 6, showing the counts of each variant in the mapped data.
snippy output
- How many variants are there in the SNPs table? How does this compare with your estimate from
JBrowsevisualisation? - Can you find SNPs from the
snippyoutput manually using JBrowse in your earlier visualisation? - Can you find any SNPs that are different or inconsistent between the
JBrowseandsnippyoutputs?
Inspect the SNPs table output box. How many lines are in the table? I estimated about 49,000 SNPs from visual inspection of JBrowse, which was much greater than the ≈22,000 reported by snippy.
Bioinformatic tools that perform the same kind of task may differ in exactly how they carry out that task. This can result in them generating output that is not identical, even if they claim to calculate the same kind of value or make the same kind of measurement.
Even different versions of the same tool might differ and produce different output, so it is good practice to explain exactly which version of a software tool you use in your work.
The PAO1 isolate was sequenced at the turn of the millennium (Stover et al. (2000)) and is a common laboratory reference straiin. It would be useful to map your isolate’s reads against an assembled genome from your study. You have one such genome assembly in ERR531413_asm.fasta
- Map your
ERR531380isolate reads to theERR531413_asm.fastaassembly usingsnippy. - How many sequence variants are there between the two genomes?
- Why might you think that your study isolate shares a more, or less, recent common ancestor with
ERR531413than with PAO1?
10.3 Next Steps
In the next section you will assemble the genome of your isolate. The resulting sequence will be informative for tracing the likely routes of transmission in the hospital ward.