11 Map Reads to the Genome
Read mapping is a common bioinformatics technique that aligns sequencing reads to a reference genome. It is often used as part of RNA-seq, or transcriptomic, analyses, where the number of sequencing reads aligned to a part of the genome indicates the level to which a gene in that region is transcribed. It is also central to technologies such as ChIP-seq (chromatin immunoprecipitation and sequencing), which enables the locations of regulatory promoter binding sites to be found.
Today, you will use the same approach to compare the Wuhan 1 strain of SARS-CoV-2 that you have assembled to a reference genome from a 2003 SARS virus strain (AY278741). To do this you will use the BWA-MEM2 read mapping software (Vasimuddin et al. (2019)) to align the cleaned forward and reverse reads from Wuhan 1 to the AY278741 genome assembly and annotation.
When reporting read mapping in a manuscript or dissertation, you should always state:
- The software tool you used, with its version number and a citation of the paper describing it (if available; provide a URL to the software if there is no paper)
- The parameters used when running the tool (if default parameters were used, state this)
- The accession numbers of the reference genome and read data (if available)
11.1 Using BWA-MEM2
- Navigate to the
BWA-MEM2tool - Select the
BWA-MEM2tool - Choose
Use a reference from history and build index if necessaryunderWill you select a reference genome… - Choose the
SARS_AY278741.fastasequence underUse the following dataset as the reference sequence - Choose
PairedunderSingle of Paired-end reads - Select the
(R1 paired)and(R2 paired)trimmomaticoutput reads - Click
Run Tool
BWA-MEM2
BWA-MEM2 can take a few minutes to run to completion.
11.2 BWA-MEM2 Output
Unlike many of the other tools you will use today, BWA-MEM produces binary file output, which is not human-readable. However, Galaxy can read it and generate a human-friendly translation. The output format of BWA-MEM2 is .bam, and this can be used as an annotation track in JBrowse.
BWA-MEM2 .bam output as text
11.3 Visualising the mapping in JBrowse
We can use the .bam file in JBrowse, but we need to set up another visualisation like that in Chapter 10.
- Navigate to the
JBrowsetool in theToolssidebar - Select the
JBrowsetool - Under
Reference genome to display, select theUse a genome from historyoption - Select the
SARS_AY27874.fastagenome file inSelect the reference genome - Click on
+ Insert Track Groupto add a new track group - In the new track group, enter
Annotationinto theTrack Categoryfield - Click on
+ Insert Annotation Trackto add a new track to hold the annotation - Make sure that the
Track Typeof the new annotation track isGFF/GFF3/BED Features - In
GFF/GFF3/BED Track Data, select theSARS_AY27874.gff3annotation file for the SARS 2003 isolate - Click on
+ Insert Track Groupto add a new track group - In the new track group, enter
Mappinginto theTrack Categoryfield - Click on
+ Insert Annotation Trackto add a new track to hold the mapping data - Make sure that the
Track Typeof the new annotation track isBAM Pileups - In
BAM Track Data, select theBWA-MEM2.bamoutput file - Select
YesunderAutogenerate SNP Track - Click
Run Tool
JBrowse to visualise BWA-MEM2 mapping data
Click on the eye icon for the new JBrowse output, and select the following tracks to be shown:
- Reference sequence
- Annotation (
SARS_AY278741.gff3) - Mapping (
SNPs/Coverage)
to obtain a visualisation of reads that map to the spike (S) protein of SARS 2003, like that shown in Figure 11.1.
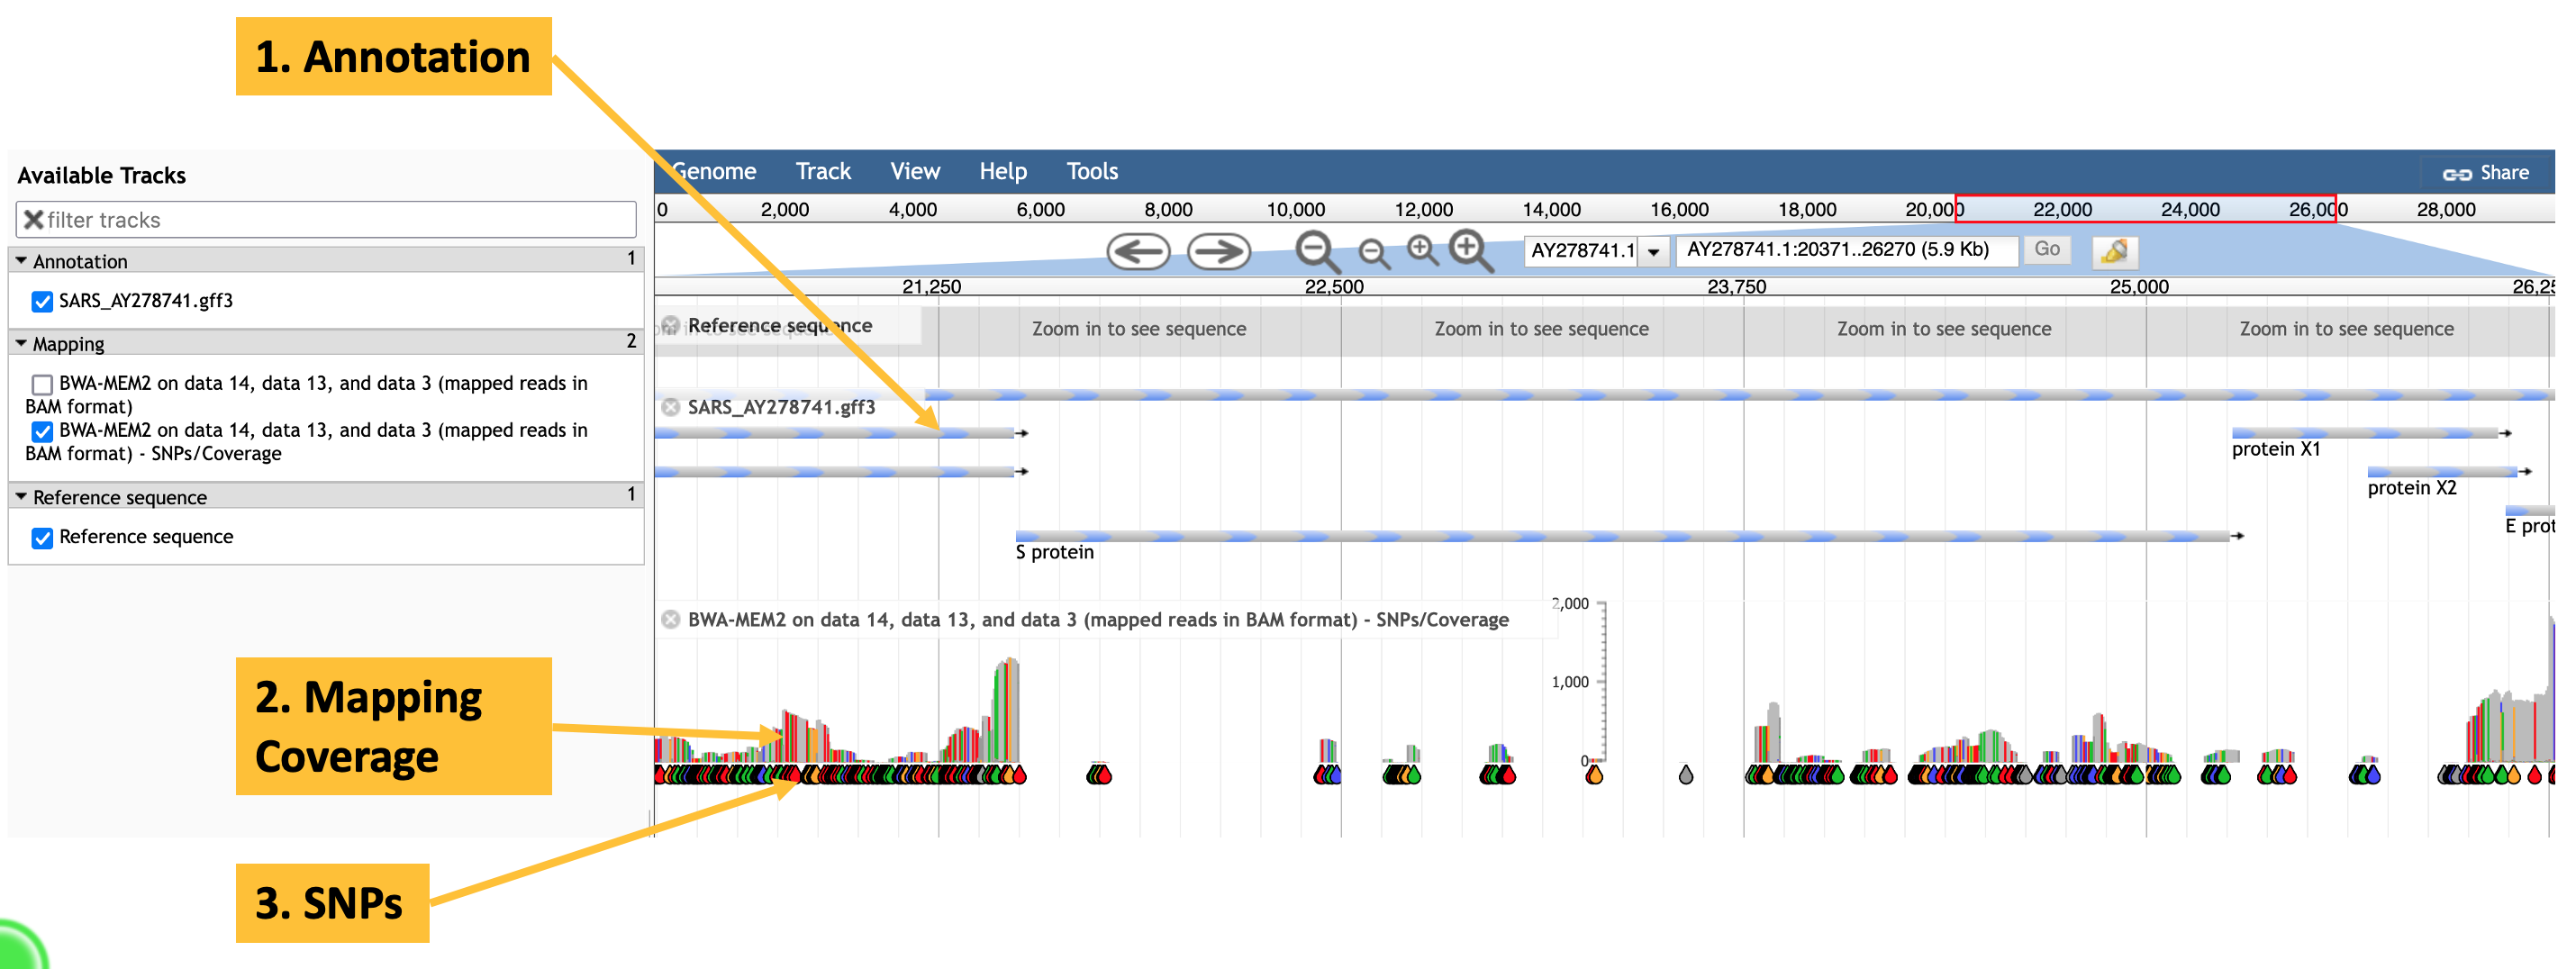
JBrowse visualisation of a BWA-MEM2 mapping of SARS-CoV-2 reads against a SARS 2003 reference genome. The annotation track shows predicted genes, including the spike (S) protein. The mapping track shows individual SNPs (teardrops), and total mapping read depth (the stacks above the teardrops).
While the spike (S) protein is being visualised, select the (mapped reads in BAM format track) to obtain a visualisation similar to the one in Figure 11.2.
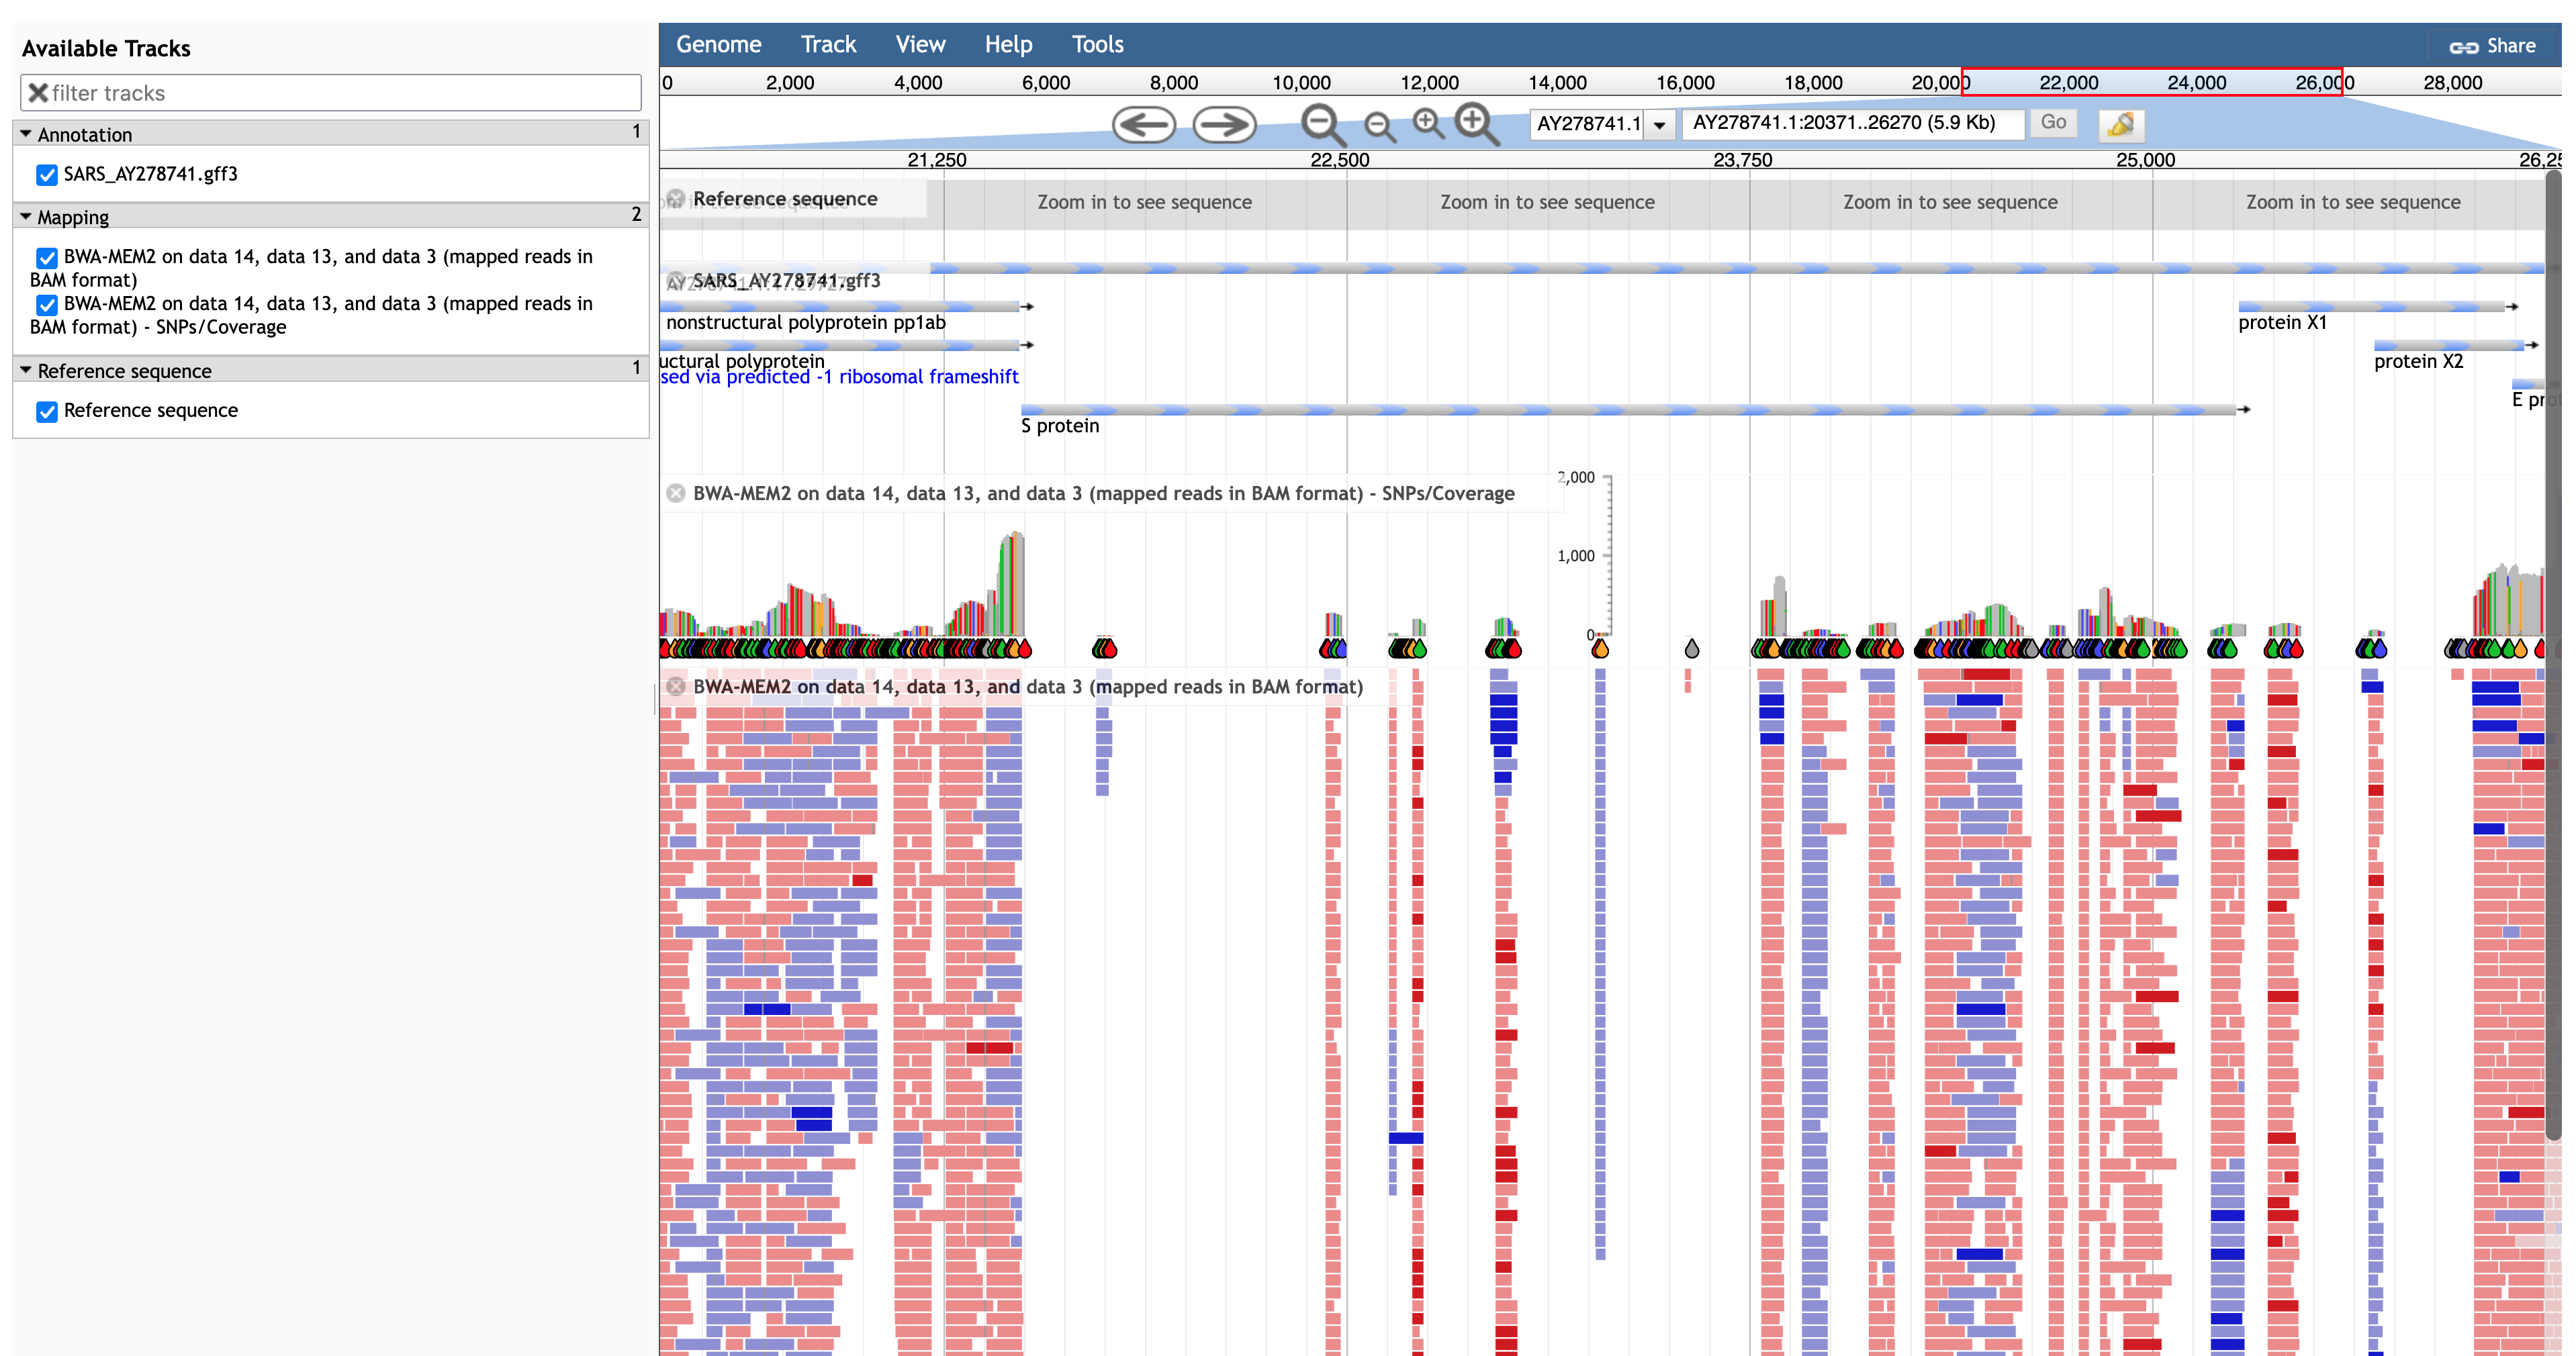
JBrowse visualisation of a BWA-MEM2 mapping of SARS-CoV-2 reads against a SARS 2003 reference genome in the regions of the spike (S) protein.
You can click on the header of the SNP track in JBrowse and select Pin to top, so that you can zoom in and see individual SNPs, as in the video below.
JBrowse
- Do SARS-CoV-2 reads map uniformly to the SARS (2003) genome
- Where do SARS-CoV-2 and SARS (2003) genomes appear to differ?
- When SARS-CoV-2 reads do map to the SARS (2003) genome, how many SNPs are there?
- What is the biological significance of the pattern of reads not matching the spike (S) protein?
- What implications does this have for vaccine development?
11.4 Next Steps
We can find SNPs by visual inspection in a tool like JBrowse, but there can be very many of them - as you can see. To ensure reproducibility and accuracy, and avoid errors we need to use dedicated software and pipelines when analysing mapping data. You will have a chance to do this in Chapter 12.