8 Assemble the Genome
The SPAdes software (Prjibelski et al. (2020)) is an excellent, multipurpose sequence assembly package.
It performs well in assembling large and small genomes, using short-read, long-read, or hybrid (both short- and long-read) inputs. SPAdes can handle single- or paired-end reads and, although specialised tools may perform better, it can also carry out metagenome assembly.
The generality of SPAdes is an advantage, but this also means that, to get the best performance in any particular situation - such as assembling a eukaryote genome from long read data - careful attention should be paid to parameter choices.
Shovill is an assembly pipeline that uses SPAdes as the assembler tool. It is optimised for assembly of small genomes using paired-end, short-read data.
Shovill pipeline
Shovill does not simply use SPAdes with a couple of changes to the settings. There is a more involved set of steps that we would otherwise need to perform ourselves to obtain a high-quality genome assembly.
- Estimate genome size and read length from reads (unless –gsize provided)
- Reduce FASTQ files to a sensible depth (default –depth 100)
- These two steps are needed because there is an optimal read coverage level for accurate assembly
- Trim adapters from reads (with –trim only)
- We have already done this with
trimmomatic(Chapter 7) so will skip the step
- Conservatively correct sequencing errors in reads
- Pre-overlap (“stitch”) paired-end reads
- Assemble with SPAdes/SKESA/Megahit with modified kmer range and PE + long SE reads
- Correct minor assembly errors by mapping reads back to contigs
- Remove contigs that are too short, too low coverage, or pure homopolymers
- This avoids including some obviously poorly-assembled sequence in our final output
- Produce final FASTA with nicer names and parseable annotations
- This is a convenience but, if you are working with the output computationally, it’s a very helpful thing
When reporting how you assembled your sequence data in a manuscript or dissertation, you should always state:
- The software tool you used, with its version number and a citation of the paper describing it (if available; provide a URL to the software if there is no paper)
- The parameters used when running the tool (if default parameters were used, state this)
- The number of contigs or scaffolds that were assembled, a measure of the average length (such as N50), and the G+C% content
8.1 Using Shovill
- Navigate to the
shovilltool using theToolssidebar in Galaxy - Select the
shovilltool - Make sure that you have selected
Paired Endas theInput reads type - Choose the
(R1 paired)output fromtrimmomaticasForward reads (R1) - Choose the
(R2 paired)output fromtrimmomaticasReverse reads (R2) - Select
NoforTrim reads(we already did this in Chapter 7) - Make sure
Spadesis selected inAssembler to use - Click
Run Tool
Shovill
Shovill can take a few minutes to run to completion.
8.2 Shovill Output
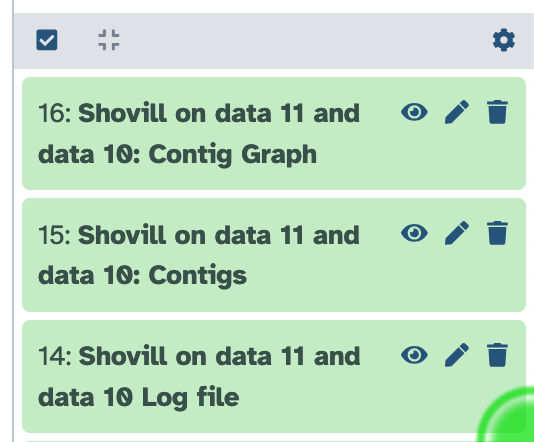
Shovill produces three output files.
- A contig file, containing the genome assembly as one or more contig sequences
- A contig graph file, describing the assembly as a graph, with assembled contigs as nodes, and edges linking them in the way the assembler thinks they might be connected
- A log file, describing the progress of the assembly run

Shovill output files in Galaxy. From the top: the contig graph file, contig file, and the log file.
As with other Galaxy tools, you can inspect the contents of these files by clicking on the filename in the History sidebar, and also by clicking on the corresponding eye icon to view the trimmed reads in the workspace.
Open the contig file output from Shovill and inspect the data.
- How many contigs (sequences) were assembled?
- How long are the assembled sequences?
- A single contig sequence is assembled.
- The length of the contig is 29878 bases.
8.3 Visualising the Assembly
The Bandage software package (Wick et al. (2015)) can take assembly output from tools such as SPAdes and Shovill, and visualise them as a graph. This is a useful step in assessing the quality of an assembly and can help identify poorly-assembled regions and potential sequencing of co-cultures of related strains, rather than an axenic isolate.
To use Bandage to visualise your genome assembly
- Navigate to the
Bandage Imagetool using theToolssidebar in Galaxy - Select the
Bandage Imagetool - Make sure that you have selected the
Contig Graphfile as theGraphical Fragment Assemblyinput - Click
Run Tool
Bandage Image
Inspect the assembly graph by clicking on the eye icon for the Assembly Graph Image output.
8.4 Next steps
With a complete genome assembly, we can begin to annotate genomic features such as gene sequences, and you will do this using Prokka in Chapter 9.