10 Visualise the Annotation
The GenBank and other files generated in Chapter 9 contain most of the information we need to understand the genome. However, being plain-text files and often quite large, they are not easy to read and process intuitively.
To get the most benefit out of genome annotations, we usually visualise them using an appropriate software tool. The choice of tool depends on the reason for visualisation. The Artemis software (Carver et al. (2012)) is useful for interactive manual annotation; Tablet is an excellent tool for investigating genome assembly and sequence variation (Milne et al. (2013)); and Proksee is an online service (Grant et al. (2023)) often used to obtain representative images of genome assembly annotations.
In this section, you will use JBrowse (Diesh et al. (2023)) to visualise your assembly and annotation interactively. JBrowse is a lightweight genome browser written in JavaScript that can run as a standalone application, or embedded as a web tool, as it is in Galaxy.
10.1 Visualising the Genome Annotation
To use JBrowse to investigate your annotation you need to tell it both what to display, and how to display it.
There are a number of new concepts being introduced here, and they may not make sense until you have tried to visualise your genome annotation.
If you follow the instructions below, and watch the video, you should find that everything works, and the meaning of unfamiliar terms like track group will become apparent.
- Navigate to the
JBrowsetool in theToolssidebar - Select the
JBrowsetool - Under
Reference genome to display, select theUse a genome from historyoption - Select the
.fnaoutput fromProkka- this is the complete virus genome - inSelect the reference genome - Click on
+ Insert Track Groupto add a new track group - this is a collection of annotations - In the new track group, enter
Annotationinto theTrack Categoryfield - Click on
+ Insert Annotation Trackto add a new track to hold the annotation you made - Make sure that the
Track Typeof the new annotation track isGFF/GFF3/BED Features - In
GFF/GFF3/BED Track Data, select theProkkaoutput.gfffile from your annotation - Click
Run Tool
JBrowse for visualisation
When the JBrowse output in the History sidebar is complete, click on the eye (View) icon to bring the visualisation to the main Workspace area. Watch the video below to see some of the features of the visualisation in action.
JBrowse interface
Using the JBrowse interface, you can select whether to show the reference sequence and/or the annotation (Figure 10.1). By clicking on the annotated features, you can bring up a window with more detail about their annotations (Figure 10.2). You can zoom into and out of the assembled and annotated genome to see individual bases and amino acids represented on the sequence (Figure 10.3).
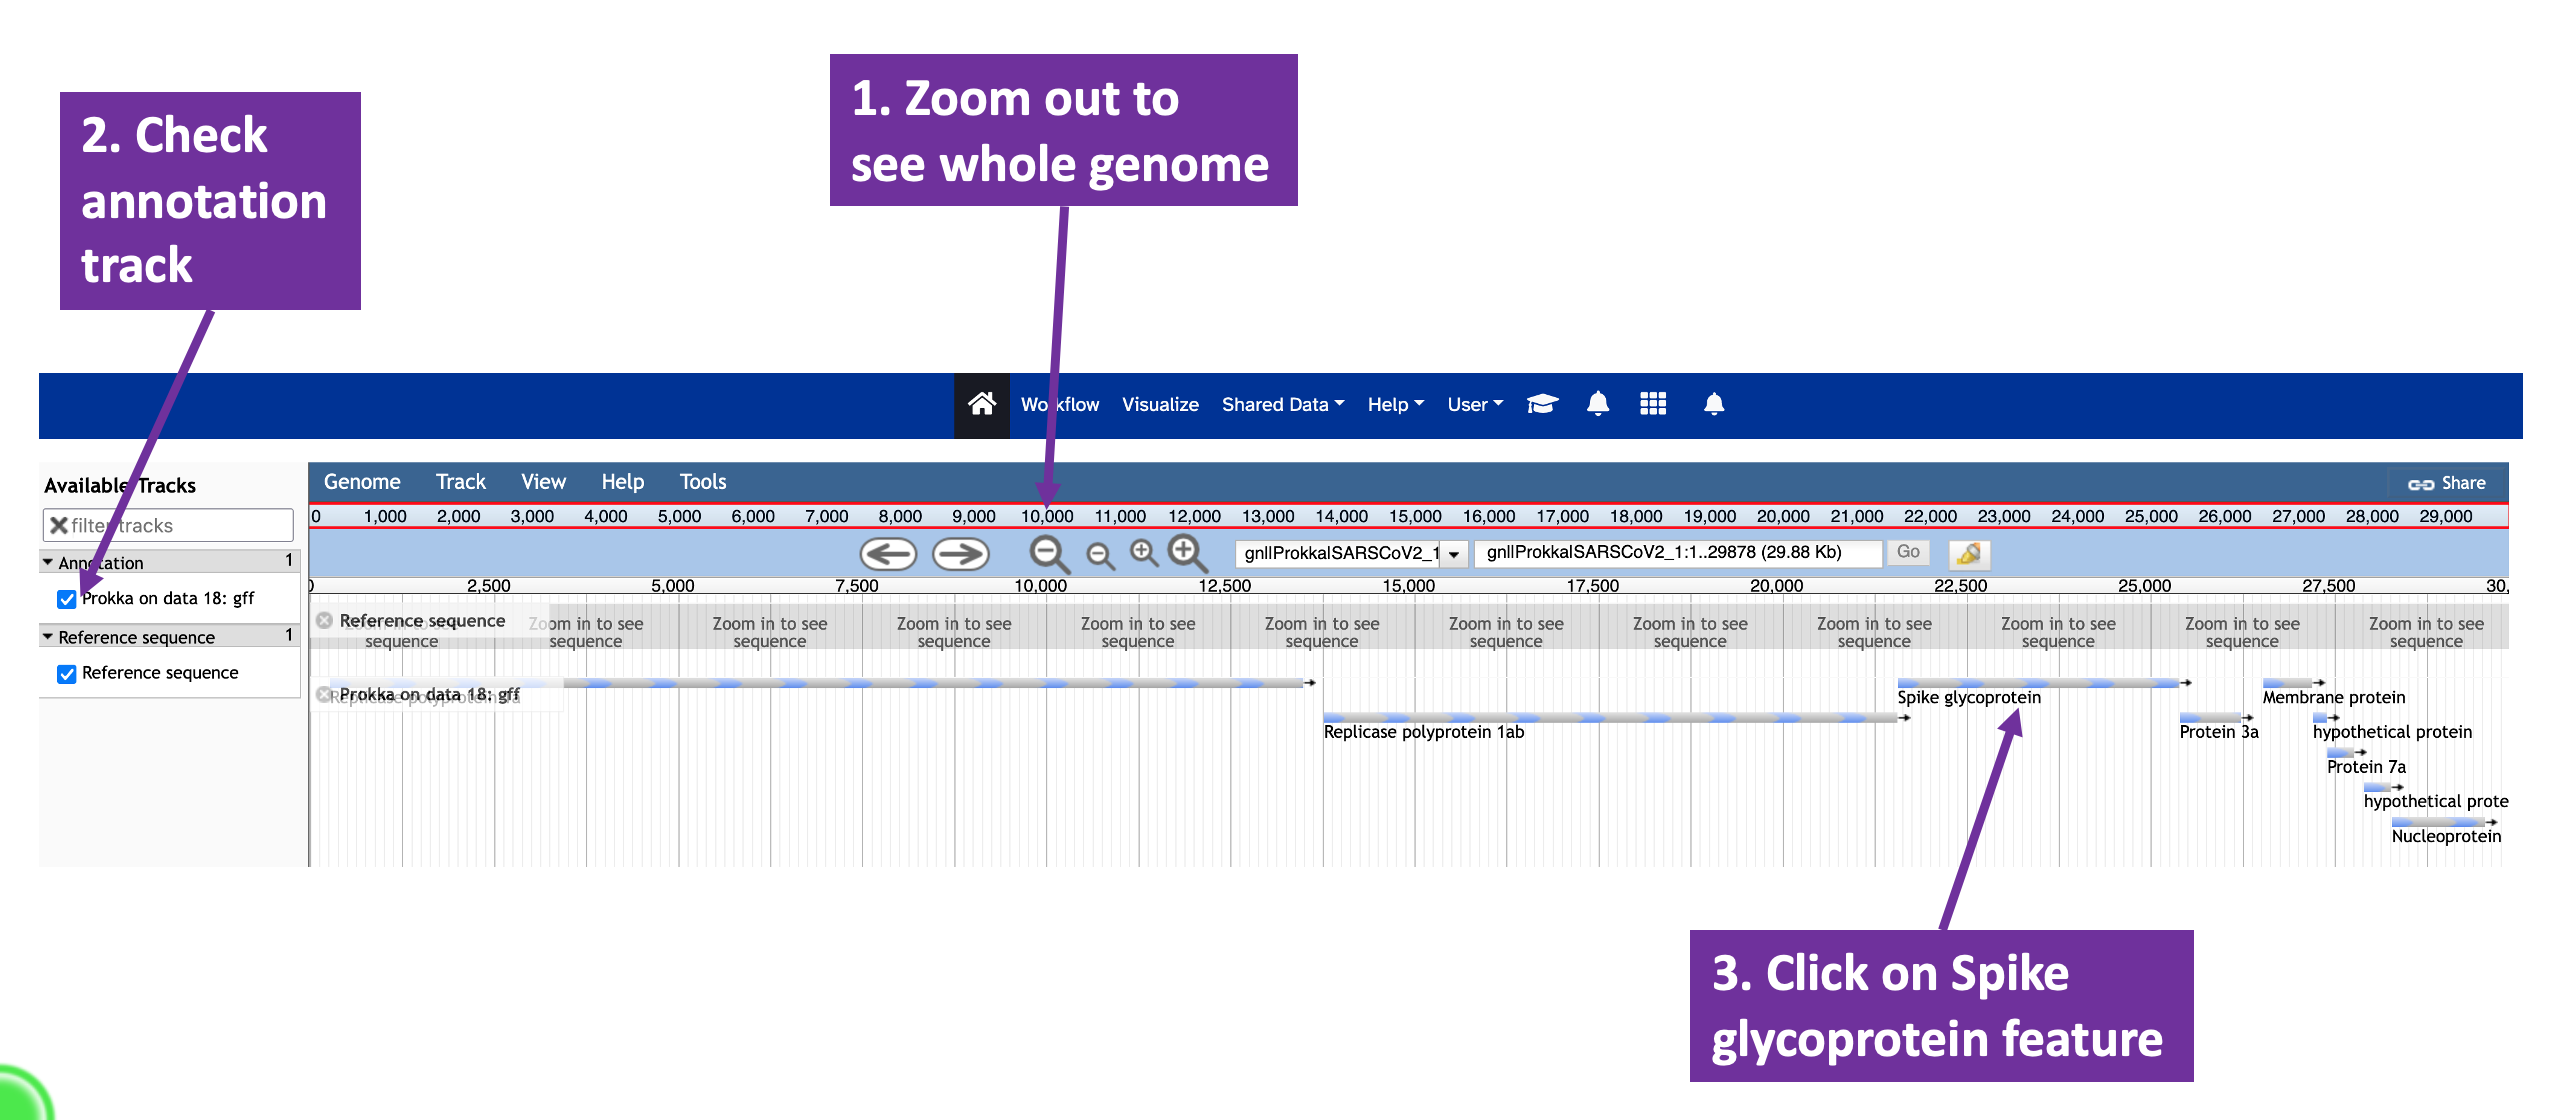
JBrowse view of the annotated SARS-CoV-2 assembly. The magnifying glass icons can be used to zoom in and out of the assembly. The check boxes to the left of the window can be used to control whether the reference genome and/or the annotation are visible. Each annotated feature is represented as a bar below the reference genome; clicking on one of these glyphs will open a window with annotation details (Figure 10.2).
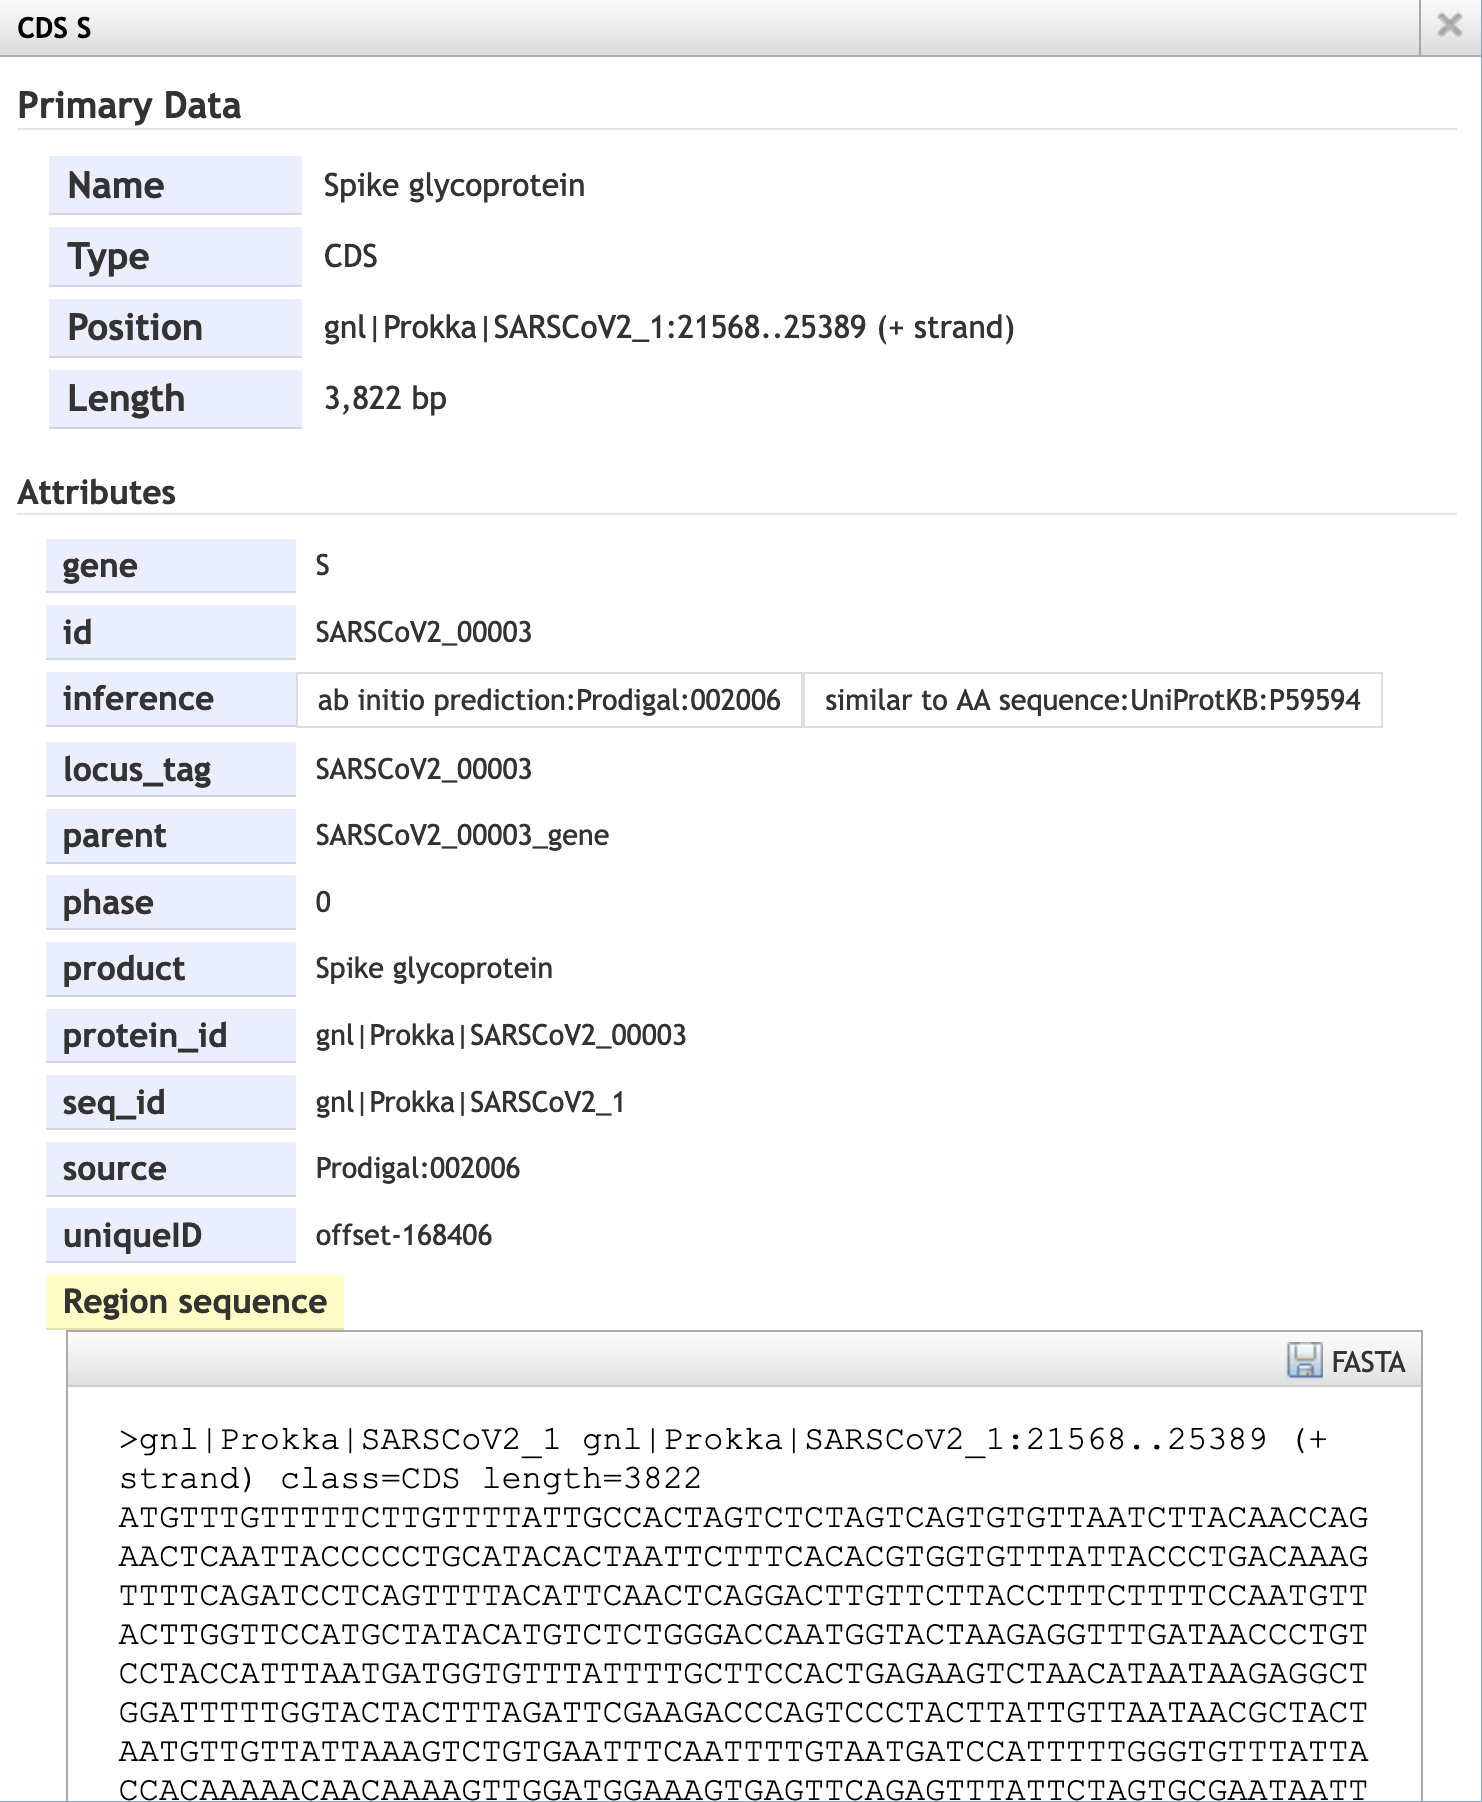
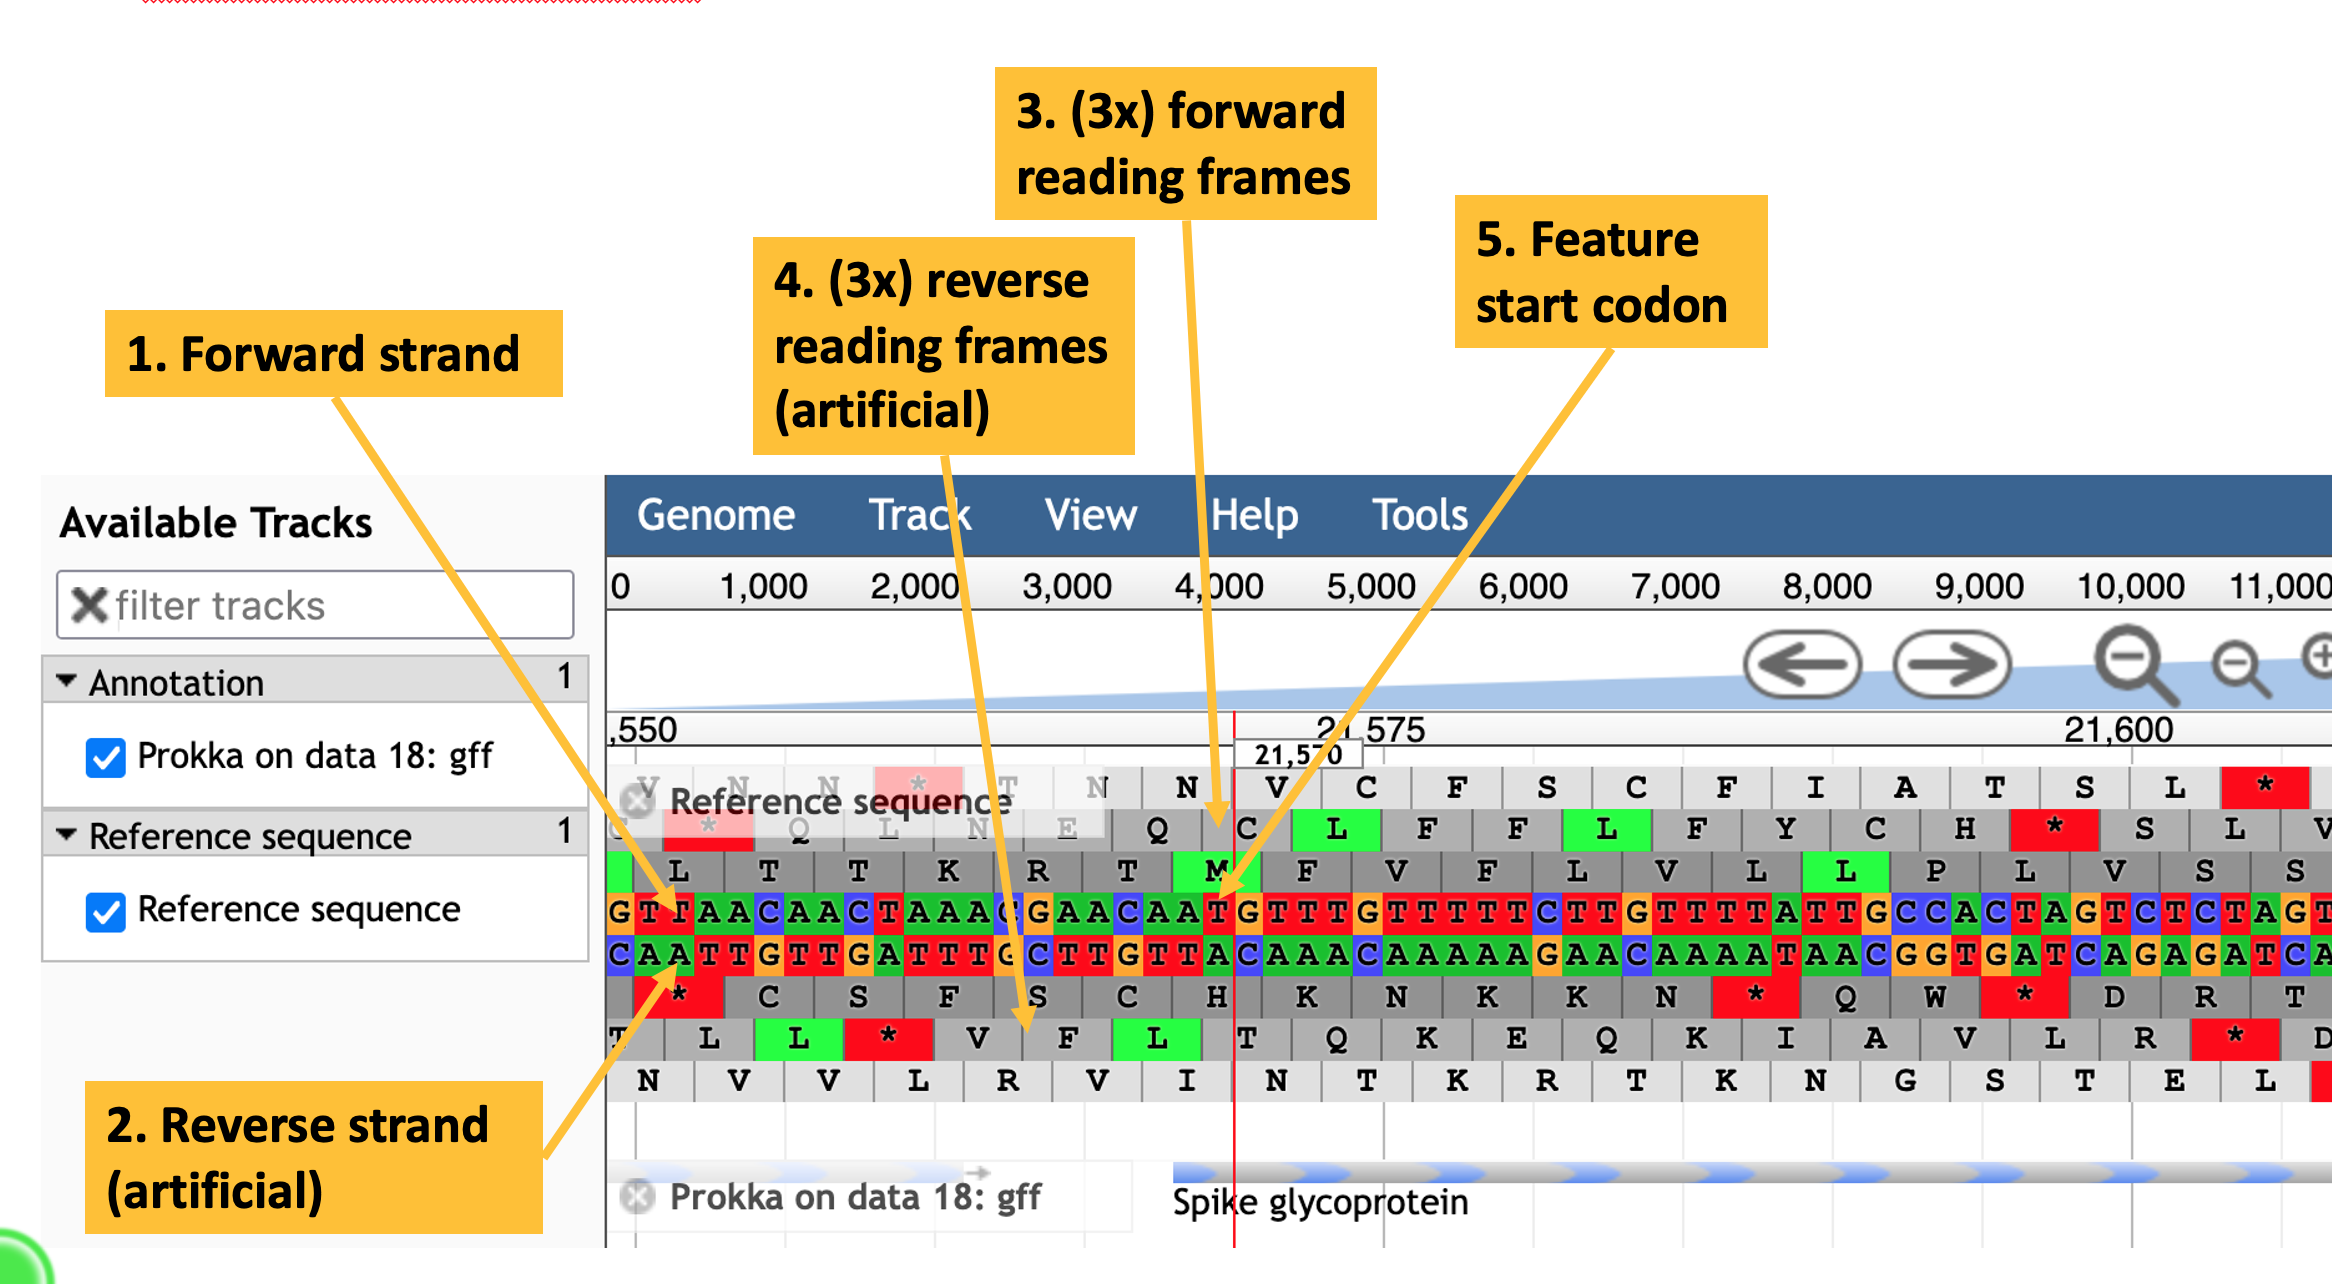
JBrowse view of the annotated SARS-CoV-2 assembly. The forward strand is the topmost of the two nucleotide sequence tracks. The lower nucleotide sequence is the reverse strand (here, because SARS-CoV-2 is a single-strand RNA virus, the reverse strand does not really exist). The three tracks above and below the nucleotide sequences are the conceptual translations of the nucleotide sequence in all three frames. Potential start codons are highlighted in green, and stop codons are highlighted in red.
10.2 Next Steps
This kind of interactive genome visualisation is especially powerful when there is additional information and data to interpret in the context of the genome, such as mapped sequence reads. You will explore this in Chapter 11.