20 Critique the Experiment
EDA provides a number of tools to help us, as researchers, improve our experimental designs and make them more rigourous. Some of these, such as the Critique tool, embody rules and principles that would be applied by a competent statistician, if you brought one in to advise on your experiment. Using these tools can save you time, and be useful as a training aid so that we can see and understand elements of good and bad experimental design ourselves, with experience.
Tools like Critique are very useful but, because they work from a finite set of rules and are not themselves intelligent, it is always useful - especially for experiments that are not very simple - to consult with a competent statistician.
In this section, we will use the EDA Critique tool to get feedback on our basic experimental design.
Good experimental design can be very difficult, and quite nuanced. But even experienced scientists with many publications and long track records of research funding may never have received any formal training in experimental design. This can, and too frequently does, give rise to experiments or results that are compromised. In the worst cases, these experiments may be unable - because of their structure - to provide useful information about the system under test. More often a poor match between the experimental design and statistical analysis gives rise to misleading results or uncorrect conclusions.
An accessible introduction to the hazards associated with poor experimental design can be found in Ben Goldacre’s books Bad Pharma (about poor research practice in the pharmaceutical industry) and I Think You’ll Find It’s A Bit More Complicated Than That, which collects his Bad Science newspaper columns, including this one:
which makes a popular presentation of a study of work published in prestigious journals such as Science and Nature (Nieuwenhuis, Forstmann, and Wagenmakers (2011)). Their paper begins:
In theory, a comparison of two experimental effects requires a statistical test on their difference. In practice, this comparison is often based on an incorrect procedure involving two separate tests in which researchers conclude that effects differ when one effect is significant (P < 0.05) but the other is not (P > 0.05). We reviewed 513 behavioral, systems and cognitive neuroscience articles in five top-ranking journals (Science, Nature, Nature Neuroscience, Neuron and The Journal of Neuroscience) and found that 78 used the correct procedure and 79 used the incorrect procedure. An additional analysis suggests that incorrect analyses of interactions are even more common in cellular and molecular neuroscience.
20.1 Run the Critique tool
- Use the
Toolsmenu and click onTools -> Critique(Figure 20.1)

Tools menu and some text from the Critique Help Centre entry
The critique involves running analysis on a remote machine, and may take a couple of minutes, so please be patient.
When the critique has finished, you will see a pop-up dialogue box describing the results of the analysis.
20.2 Read the critique results

It turns out our experimental design has some issues: five errors, 19 warnings, and an advice message. Our simple design might be a bit more complicated than we think.

- Click on the
OKbutton - Note the locations and kinds of feedback the
Critiquetool provided (Figure 20.4)
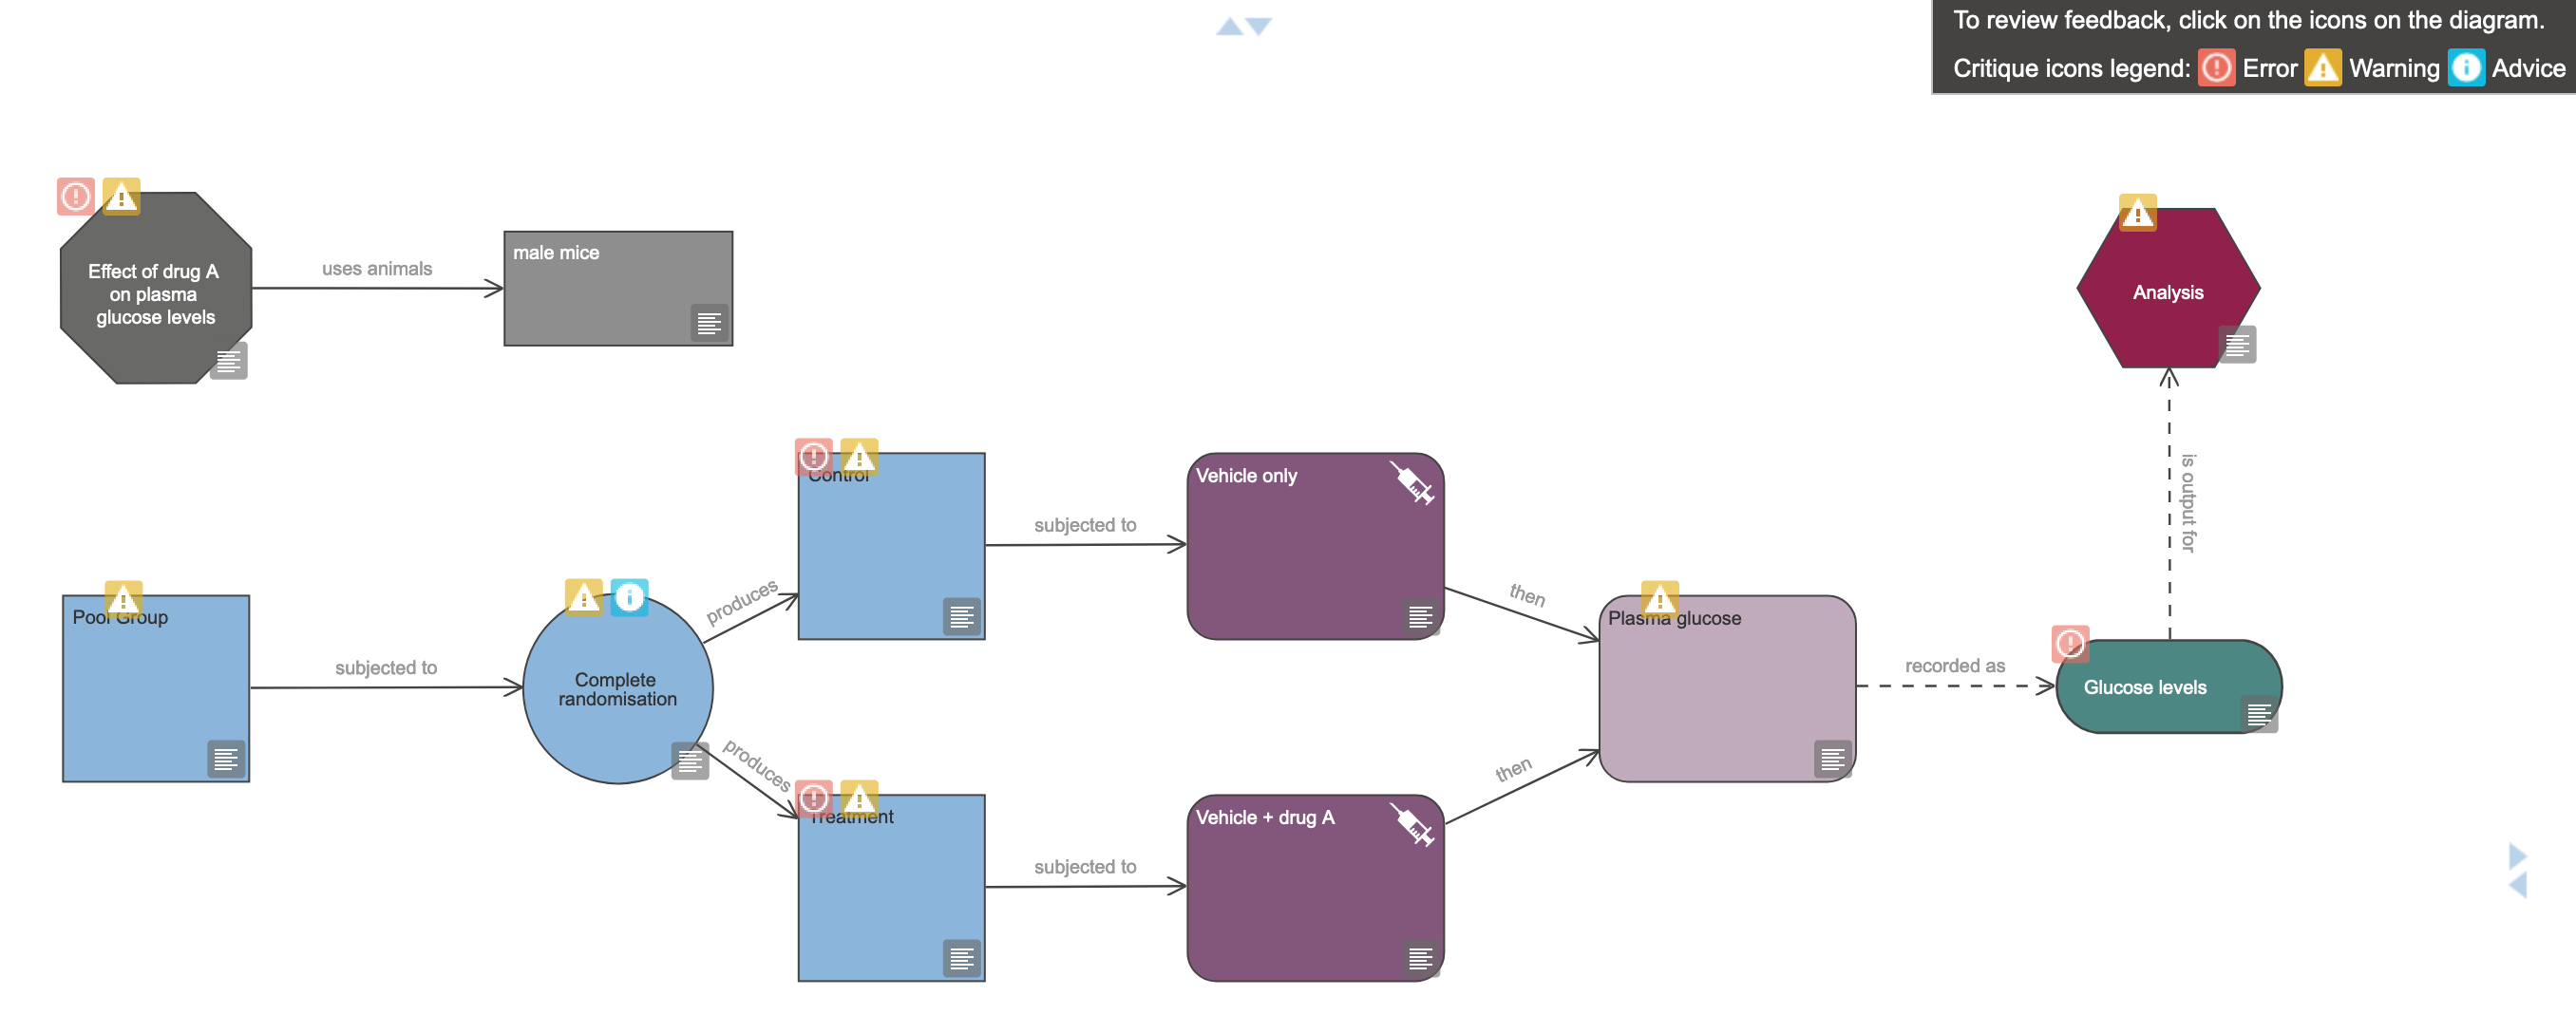
The EDA Critique tool reports three kinds of issue:
- Errors are critical problems with the design that would prevent the tool from being able to decide upon an appropriate statistical analysis, or that would indicate structural problems with the design, such as missing or inappropriate elements, that would compromise the experiment fatally. Errors will block further analysis of the experimental design.
- Warnings are generally about missing information that, while not compromising the experiment to the point that it just won’t work, may result in inappropriate analyses. A typical example of this is when the design does not take experimental subject sex into account, this is raised as a warning. Working with a single sex can be justified (e.g. prostate cancer research, breast cancer research) but in general is not good practice and can compromise the interpretation or applicability of results. Warnings typically highlight where clarification could alter the analysis method or interpretation.
- Advice labels are similar to warnings in that they highlight ambiguities or areas where unstated decisions might alter the conduct or interpretation of the experiment. They are typically less severe than warnings.
Errors must be fixed for the experimental design to be considered at all usable. Issues flagged as warnings or advice notices need not be fixed, as the choices made may be justified. However, it is always worthwhile inspecting the warnings, as attending to them may help clarify and improve the design.
It can help to have a strategy to approach dealing with Critique tool output. Two principles might help resolve issues more efficiently.
- Deal with errors first, then warnings, then advice
- Issues in the Experiment node might affect other nodes in the experiment, so attend to these first.
- Issues in nodes “early” in the experiment (e.g. in defining experimental groups) might affect nodes “downstream” in the experiment, so work from defining your groups through to the analysis step.
On this page we will deal only with the highlighted errors. Later in the workshop we will handle an implication of one of the warnings.
20.3 Resolve Experiment node errors
- Following our advice in the box above, click on the red error box associated with the Experiment node to see the error message (Figure 20.5).
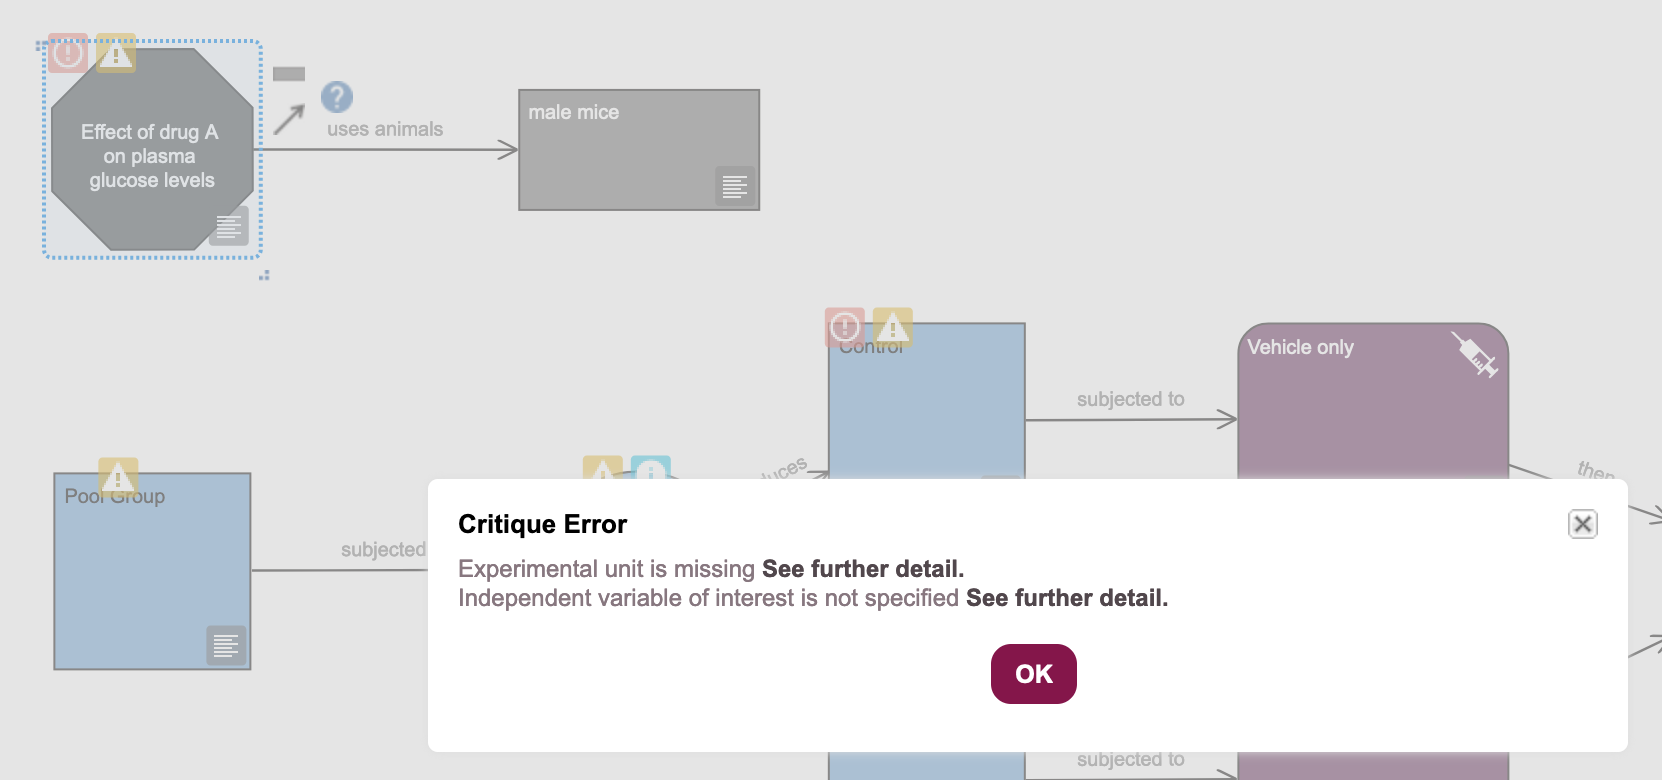
The bold text in the error dialogue box provides links to help text and advice about resolving each specific error, and what options are available to you.
20.3.1 Resolve the “experimental unit” error
- Click on the
OKbutton to close the dialogue box.
An experimental unit is the subject that is exposed to an intervention, in the course of the experiment, independently of other experimental units. Most of the time in in vivo research the experimental unit is a single animal, but it might in some cases be a group of animals, part of an animal (if you are testing distinct limbs of the same animal, for instance), or the same animal at different periods of time.
The sample size of an experiment is the number of experimental units in each group. It is critical for good statistics, and being able to make an appropriate inference from your experiment, that the experimental unit is well defined.
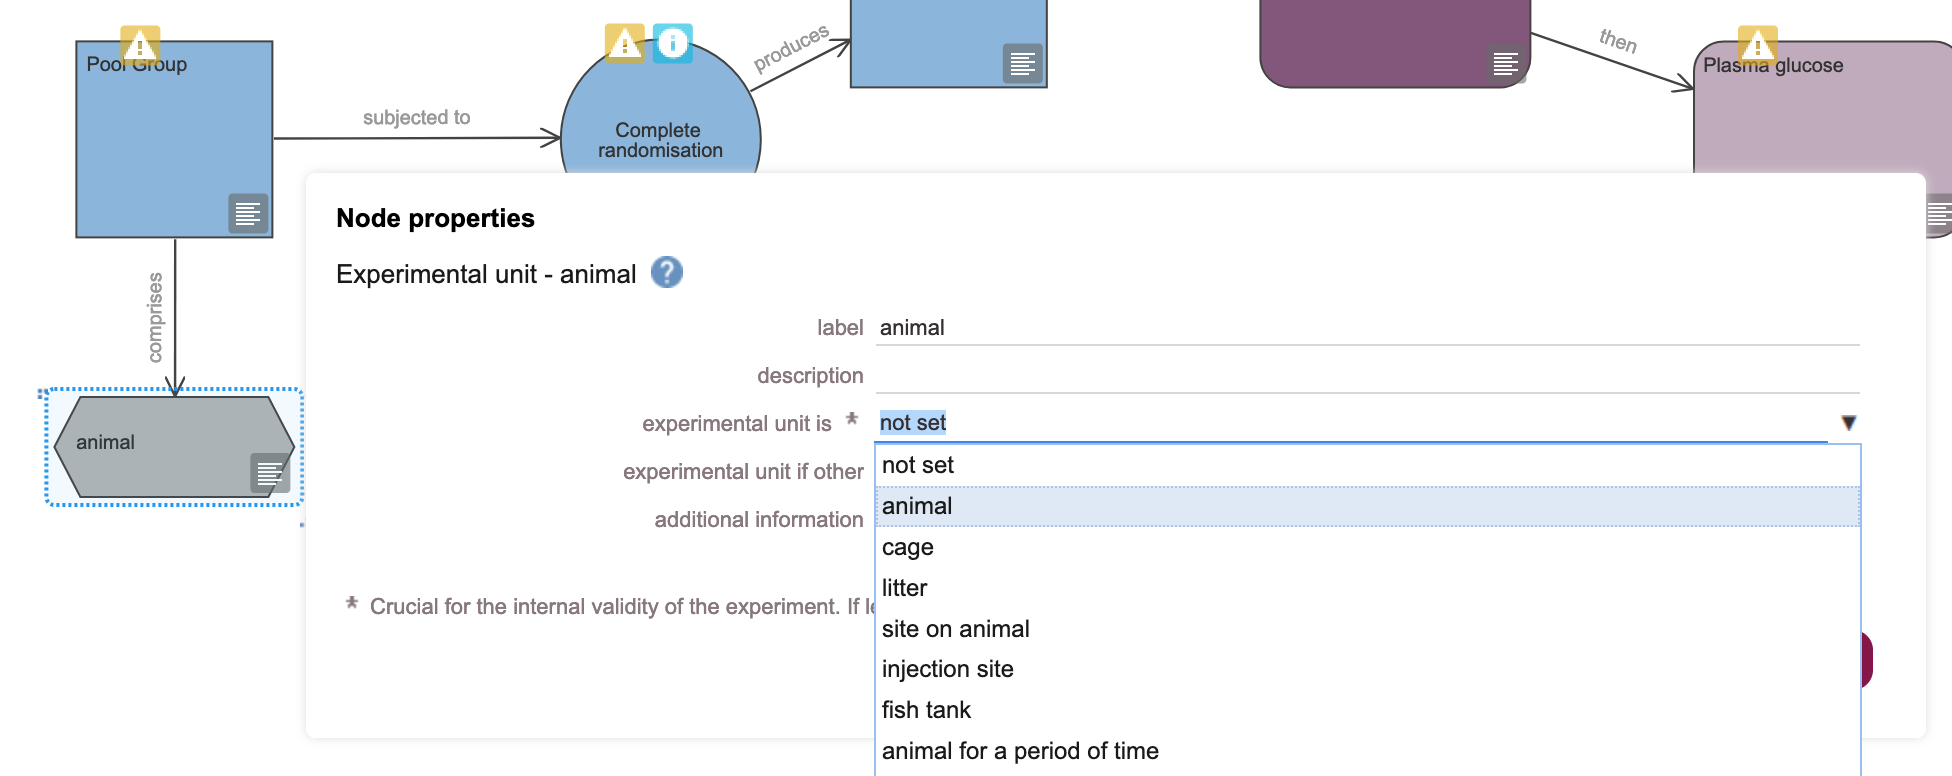
In the workshop experiment, we are taking a systemic measurement of blood glucose from each animal at the endpoint of the experiment, so our experimental unit is the animal.
- Add a new Experimental unit node, by clicking on the grey lozenge in the Pool Group node’s icon menu (Figure 20.6).

- Drag the new node into a clear space, and click on the
propertiesicon to bring up the Node properties pane (Figure 20.7).
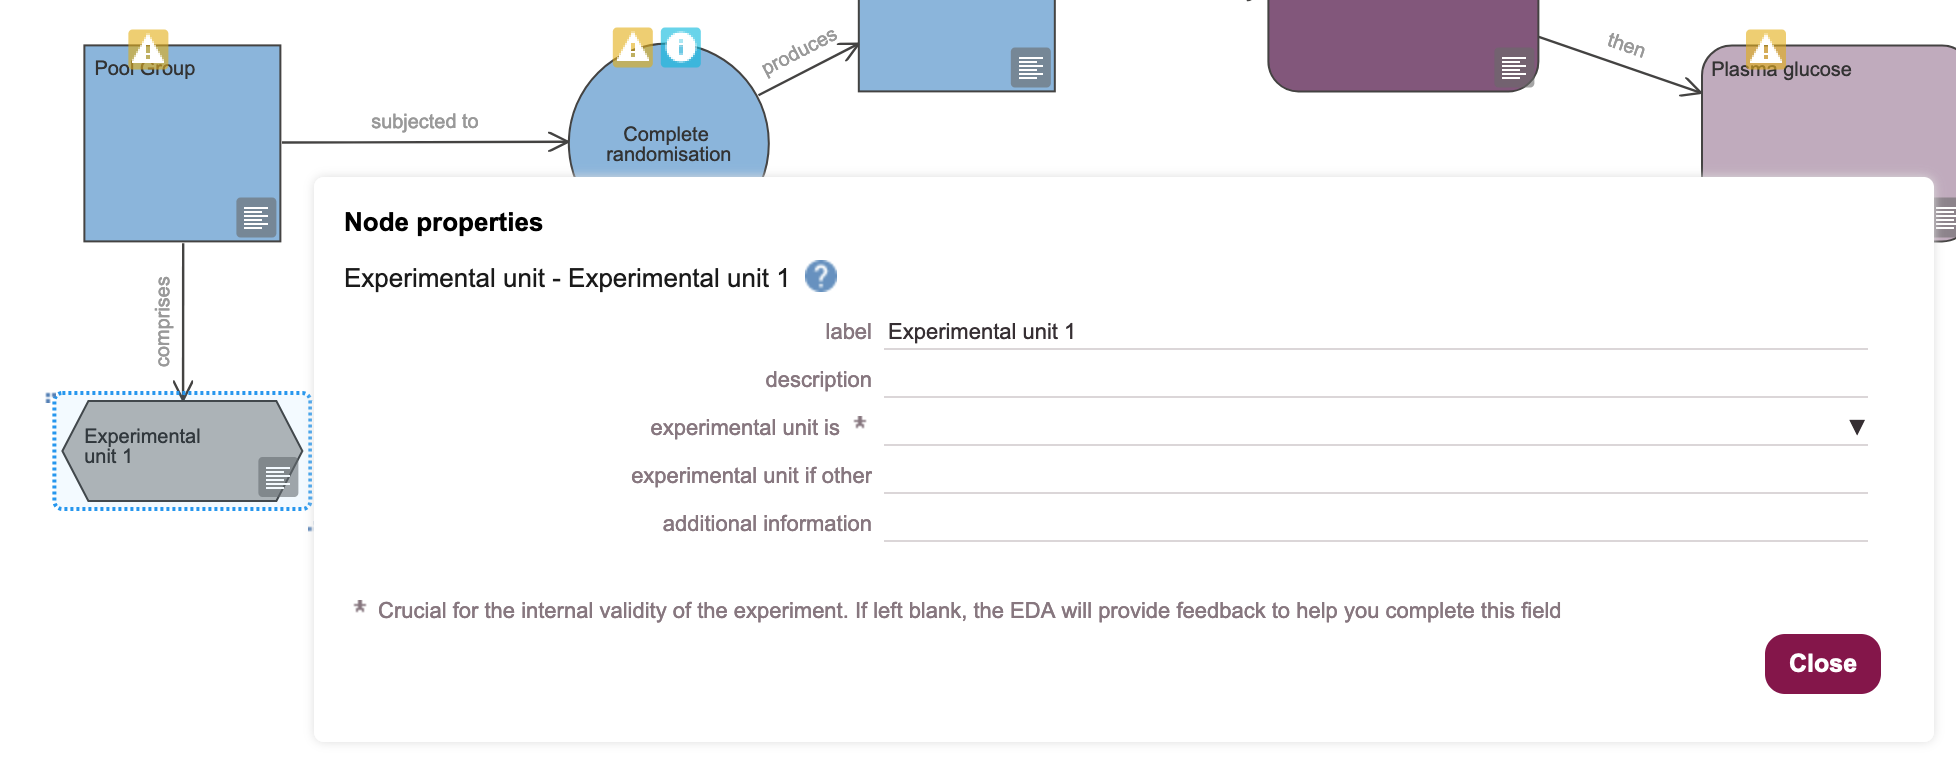
- Rename the node in the label field as “Animal” and select “animal” from the experimental unit is drop-down (Figure 20.8). Then click the
Closebutton.
20.3.2 Resolve the “independent variable of interest” error
An independent variable of interest in an experiment is a parameter that is under the control of and/or manipulated by the experimenter. Other terms for the same thing include parameter, predictor, or factor of interest.
Here, our independent variable of interest is drug A, as we are testing the response of animals in the presence or absence of the drug, and the administration of the drug is under the experimenter’s control.
To add an independent variable of interest to our design, we need to introduce two new node types:
- An Independent variable of interest node, which states what the variable itself is (e.g. dosage, surgery, drug)
- Two Variable category nodes, because our variable is categorical - it is subdivided into two categories: “vehicle only”, and “vehicle + drug”.
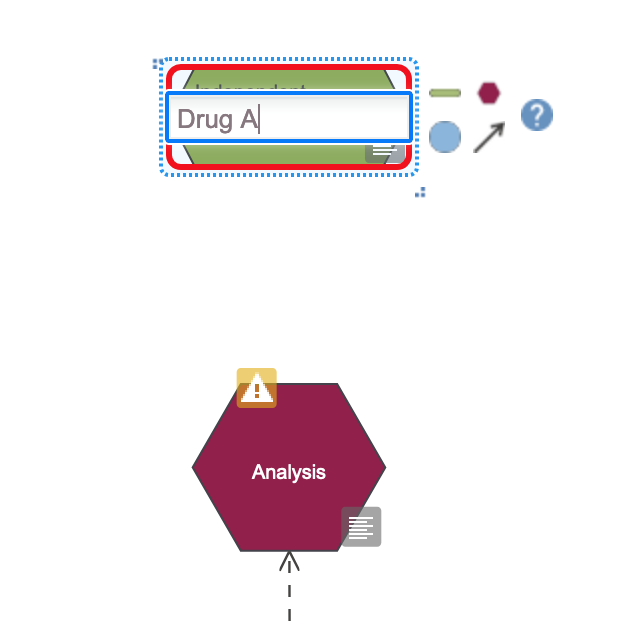
- Drag an Independent variable of interest node from the sidebar on the left, onto the canvas. Double-click on the node, and rename it as “Drug A” (Figure 20.9).
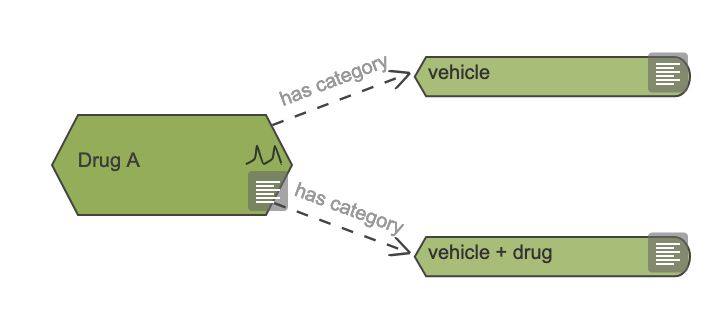
- Use the green lozenge icon in the Drug A Independent variable node you just made to create two Variable category nodes, linked to the independent variable (Figure 20.10).

- Rename the Variable category nodes as “vehicle” and “vehicle + drug” (Figure 20.11).
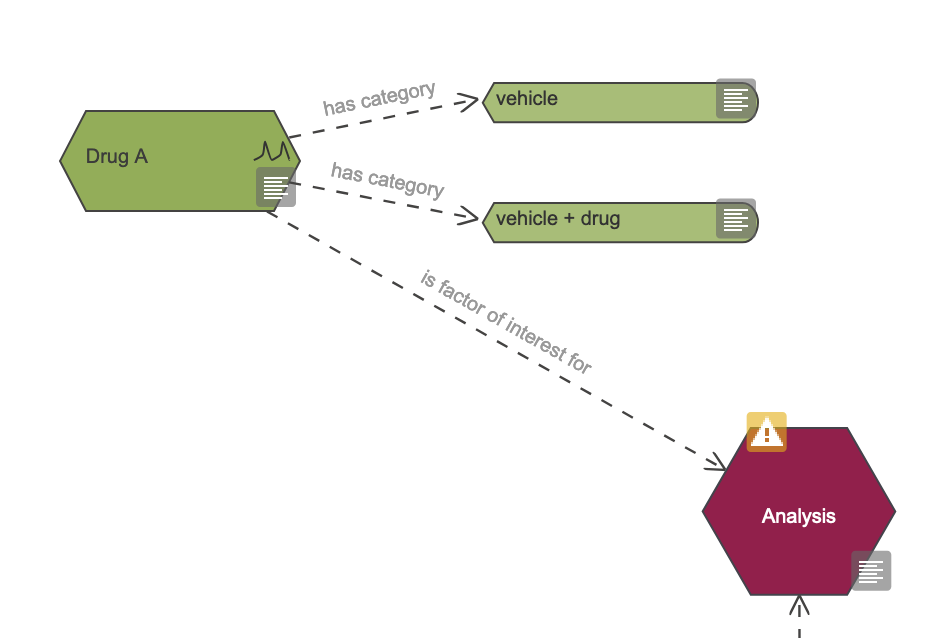
- Link the “Drug A” variable to the Analysis node by dragging the arrow icon from the “Drug A” node icon panel onto the Analysis node (Figure 20.12). This adds an arrow to the diagram indicating that “Drug A” is a factor of interest for the analysis.
20.4 Rerun the Critique tool
The usual way to run the EDA tool is to critique your design, then fix one or more issues, and run the critique again to see what has changed. We repeat the cycle until the Critique tool reports no errors or issues.
- Use the
Toolsmenu and click onTools -> Critique - Read the critique output.

The output suggests that we have more errors than before, even though the errors on the Experiment node have been successfully resolved (Figure 20.3).
20.5 Resolve Group node errors
- Click on the
OKbutton to close the critique results. - Click on the Error icon, on the Control Group node. This brings up a popup warning us that the experimental grous are not differentiated from each other: the EDA tool cannot tell the difference between the two groups (Figure 20.14).
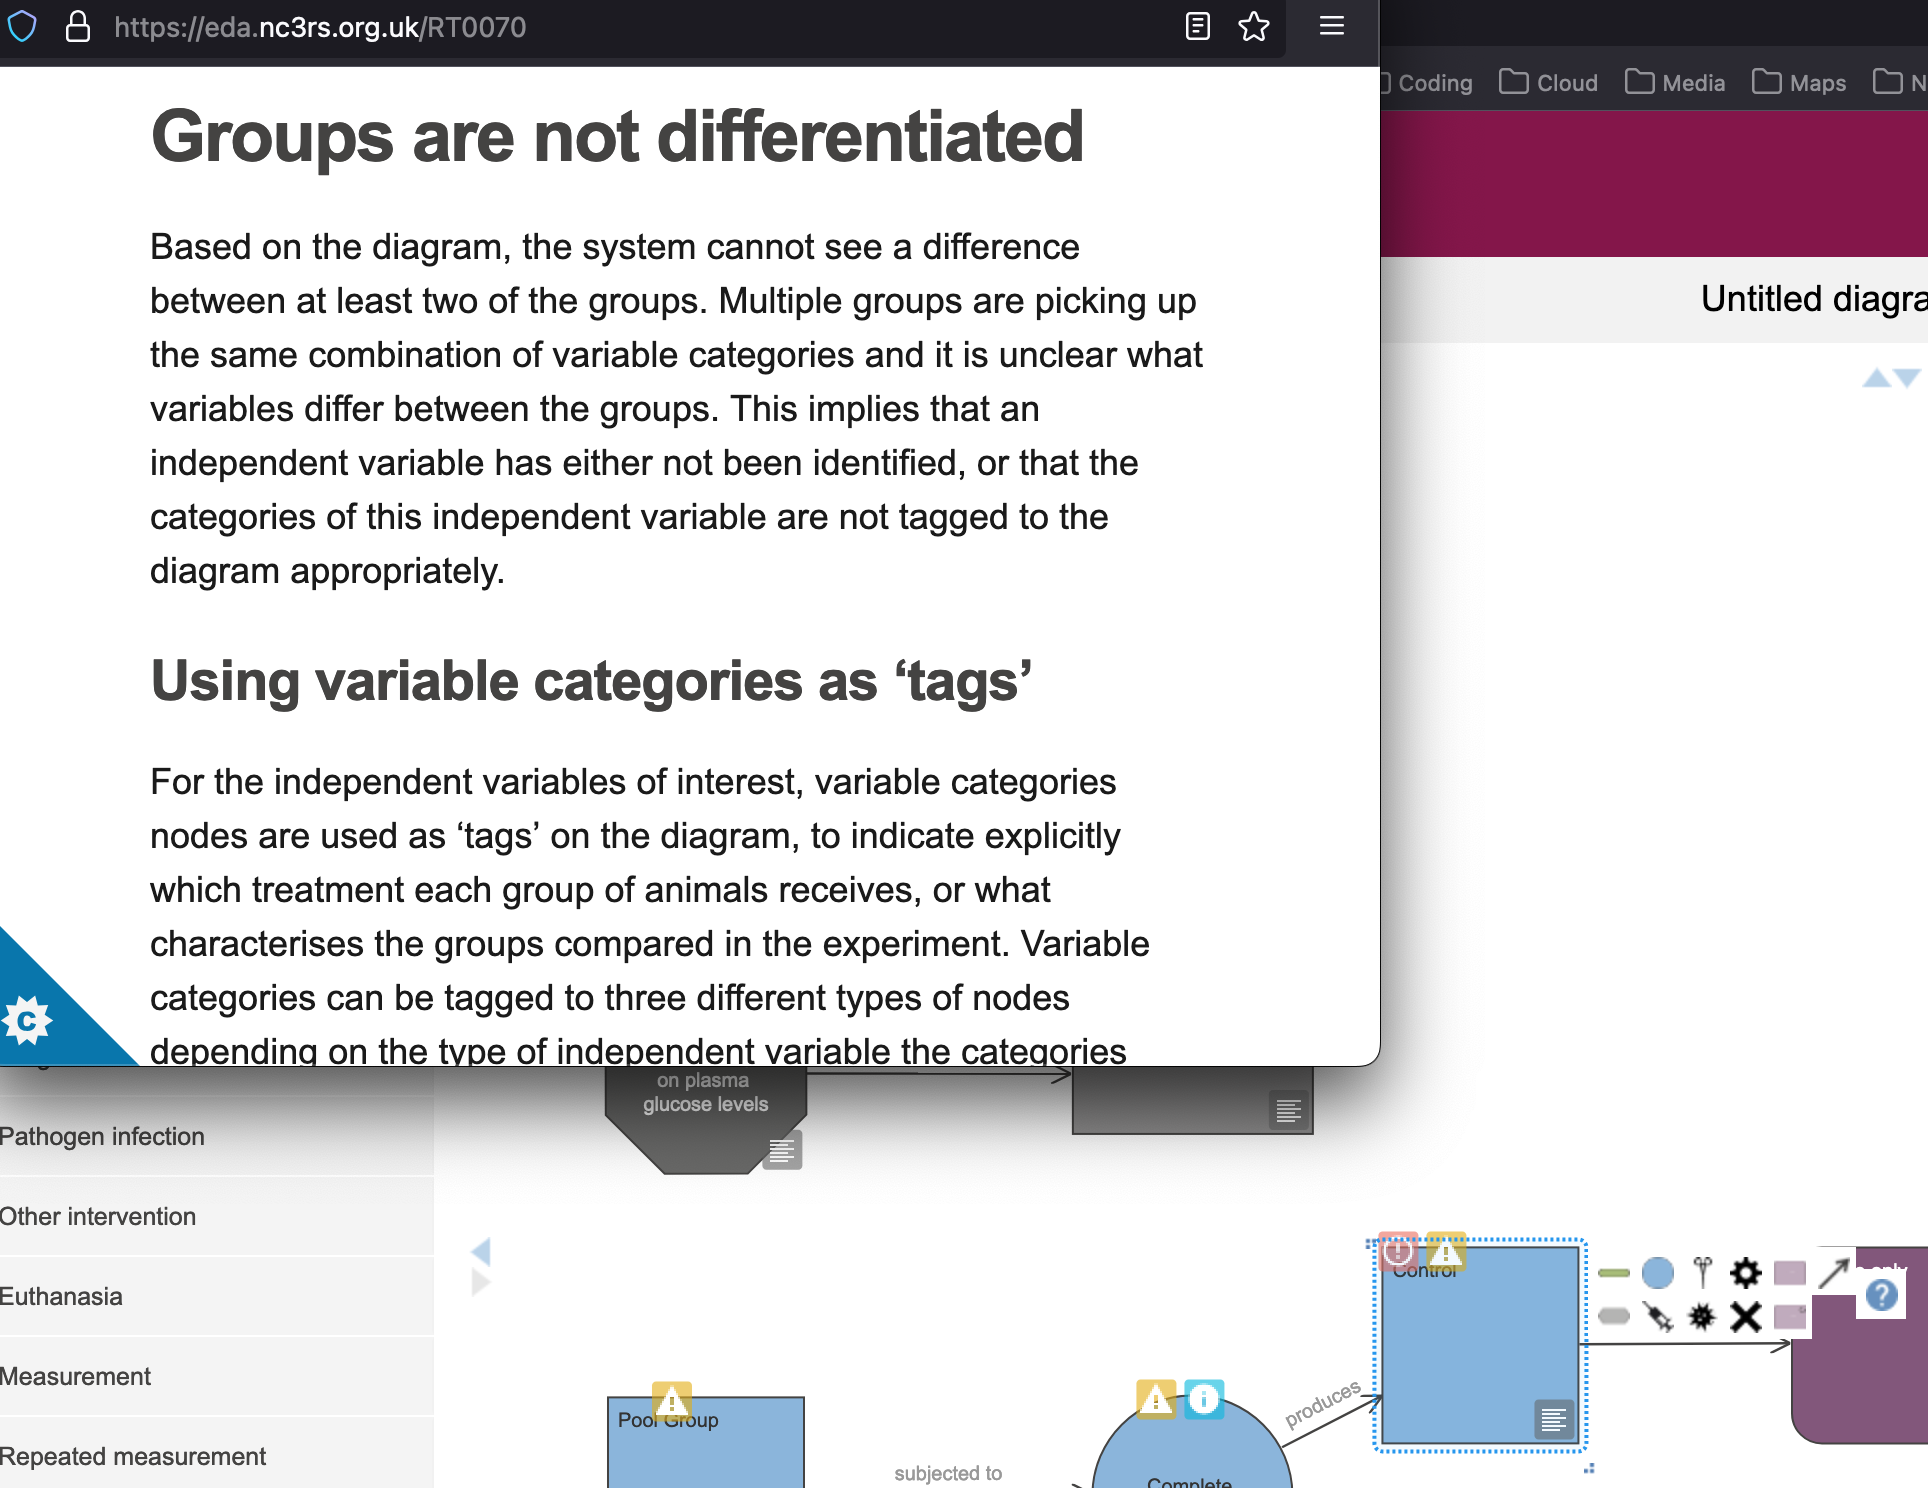
The EDA tool advises us to use the Variable category nodes we created earlier as “tags”. This means that it wants us to assign the variable categories (“vehicle” and “vehicle + drug”) to explicitly associate one or more variable categories with each Pharmacological intervention node. Doing so tells the design tool which variable in the statistical analysis is associated with which practical intervention in our experiment.
To do this, we need to duplicate the two Variable category nodes, and drag one each to the appropriate Pharmacological intervention node.
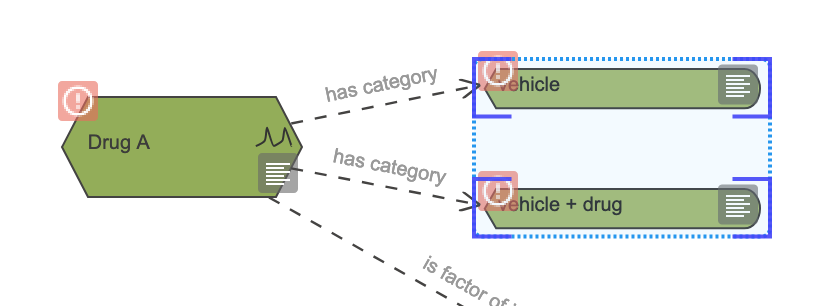
- Select the “vehicle” and “vehicle + drug” nodes by dragging a box around the two green lozenges (Figure 20.15).
- Use the
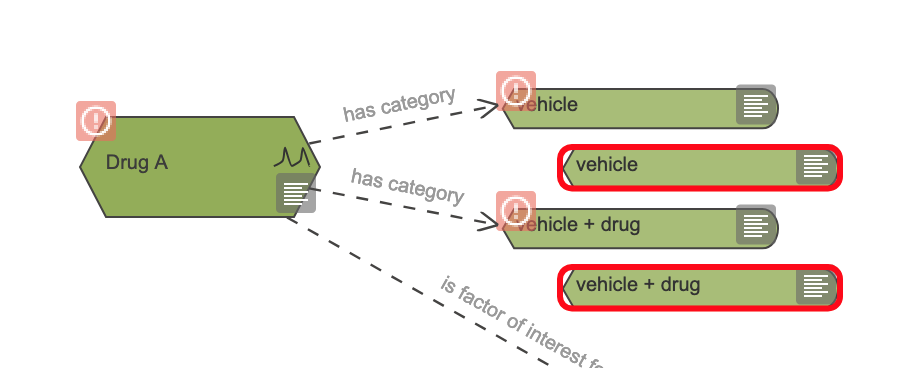
Edit -> CopyandEdit -> Pastemenu items (Figure 20.16) to create copies of both nodes (Figure 20.17).

Edit menu.
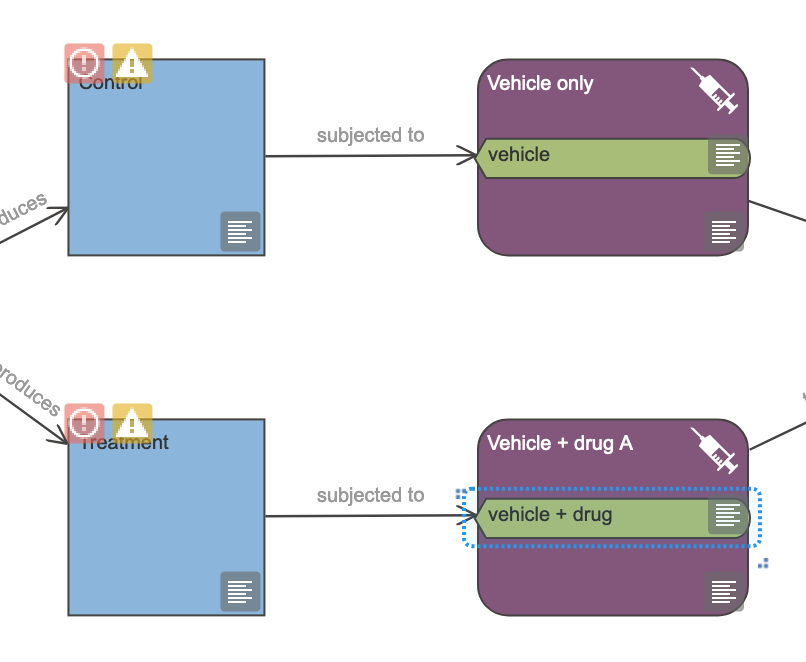
- Drag the “vehicle” Variable category node onto the “Vehicle only” Pharmacological intervention node (a green box will appear around the Pharmacological intervention node, when it is in place).
- Drag the “vehicle + drug” Variable category node onto the “Vehicle + drug A” Pharmacological intervention node. Both interventions are now tagged with the appropriate variable category (Figure 20.18).
20.6 Rerun the Critique tool
- Use the
Toolsmenu and click onTools -> Critique - Read the critique output.

Everything is not fixed (Figure 20.3), but at least we are reducing the total number of errors.
20.7 Resolve Outcome measure node errors
- Close the critique output by clicking on the
OKbutton. - Click on the Outcome measure node’s Error icon. This brings up a popup warning us that the EDA tool does not know whether the outcome measure is continuous or categorical.
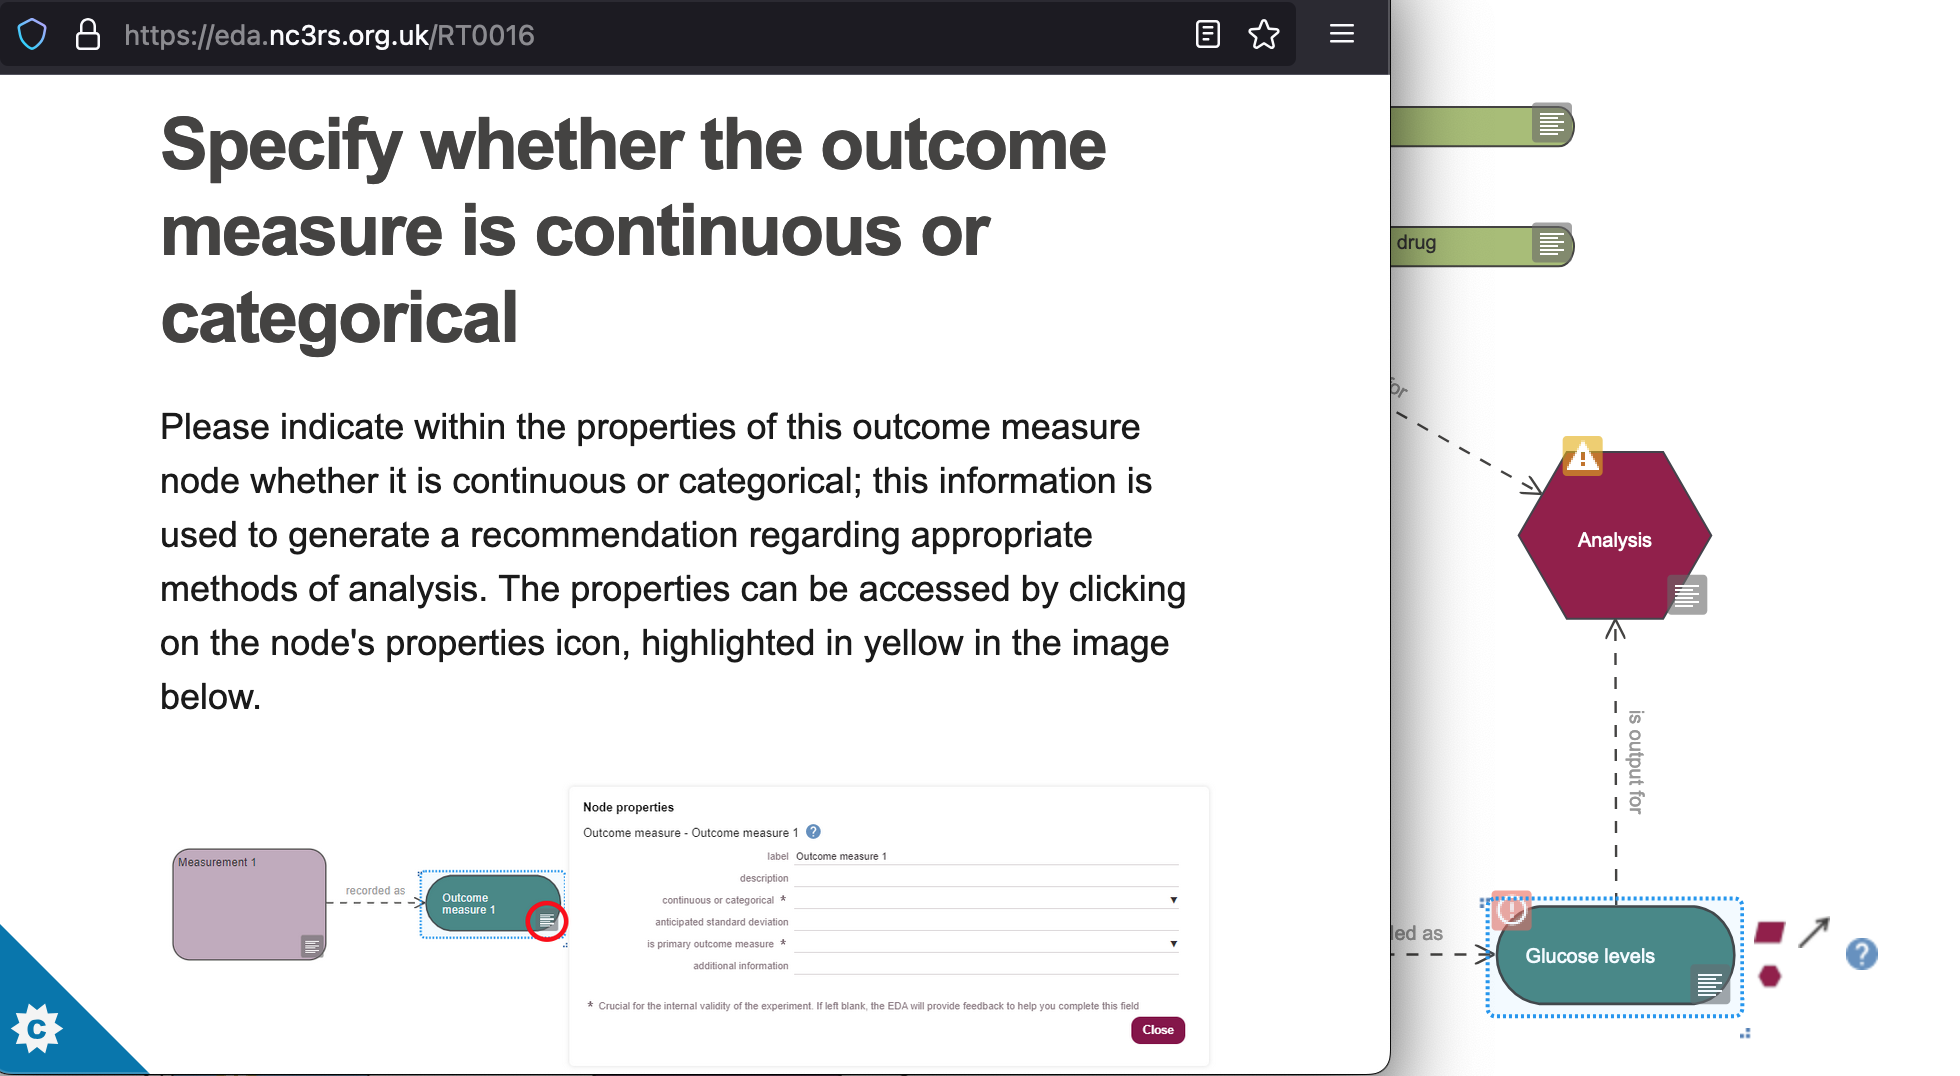
In general, variables in a statistical analysis can be either continuous, or categorical. We need to know whether variables (independent variables or outcome variables) are continuous or categorical in order to be able to determine an appropriate statistical approach.
- continuous variables represent measures that can take any value along a continuum, like dose concentration, weight, or age
- categorical variables represent measures that can be members of one of a limited set of categories, like “high dose”/“low dose” (two categories); “underweight”/“normal”/“overweight”; or “infant”/“child”/“adult”.
If the EDA tool does not know what kind of data is measured in the experiment, it cannot recommend a statistical approach.
In this experiment, our outcome measure is glucose concentration in plasma, which is a continuous variable.
- Click on the Node properties icon for the “Glucose levels” Outcome measure node and select “continuous or discrete” from the continuous or categorical drop-down options, and set the is primary outcome measure to “yes” (Figure 20.21). Then click on the
Closebutton.

20.8 Rerun the Critique tool
- Use the
Toolsmenu and click onTools -> Critique - Read the critique output, then click on the
OKbutton to close.

All of the errors are still not fixed (Figure 20.3), but we’re nearly there.
20.9 Resolve Independent variable of interest node errors
- Click on the Error icon, on the Independent variable of interest node. This brings up a popup explaining what errors EDA finds (Figure 20.23).
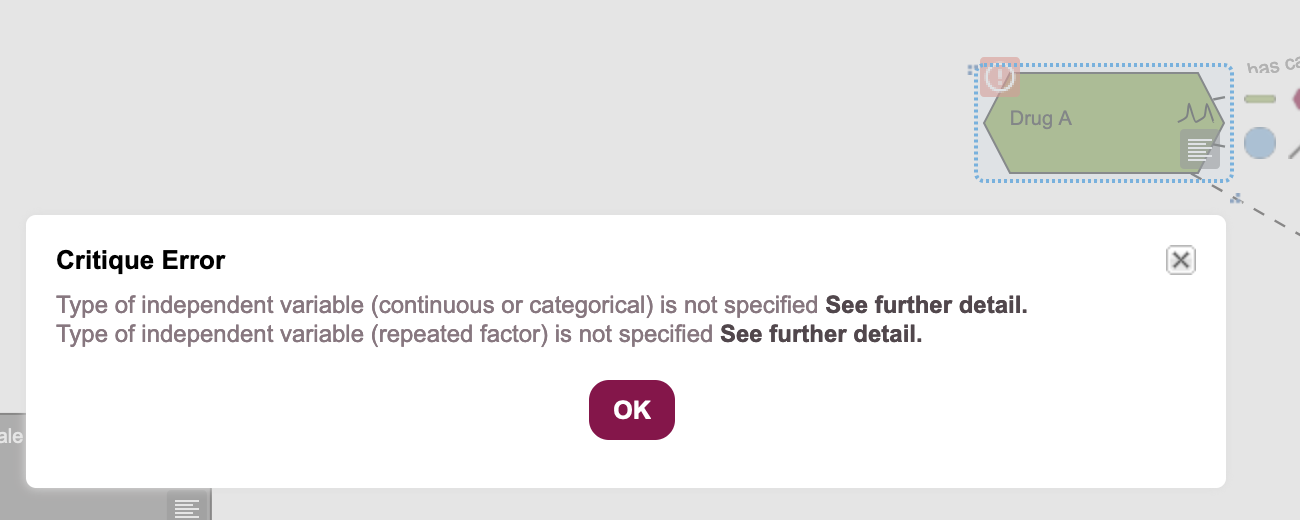
- Click on the
OKbutton to close the dialogue box. - Click on the Node properties icon, on the “Drug A” Independent variable node to bring up the Node properties panel.
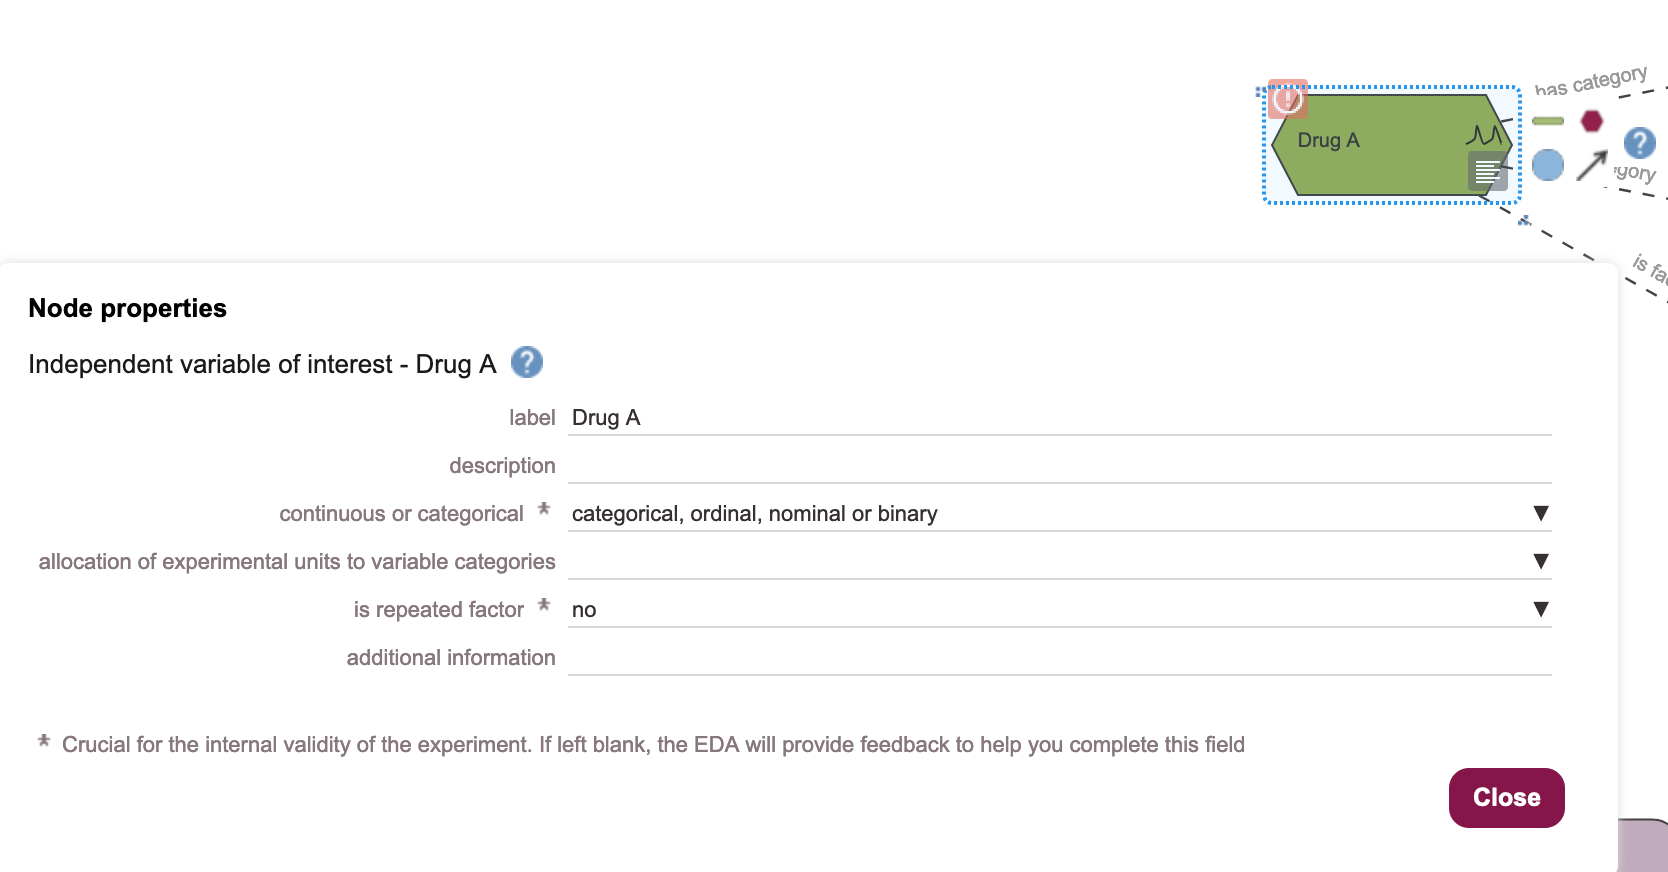
- Our “Drug A” variable is categorical (the drug is either present or not), and we are taking a single endpoint measurement, so it is not a repeated measure. Set the continuous or categorical field to “categorical, ordinal, nominal or binary”, and the is repeated factor field to “no” (Figure 20.24), and click on the
Closebutton.
20.10 Rerun the Critique tool
- Use the
Toolsmenu and click onTools -> Critique - Read the critique output, then click on the
OKbutton to close.

We have fixed all of the errors, and can proceed to inspecting the warning messages, to clarify the experimental design further.