7 Tetrahedron Earth
We’re going to analyse our data statistically, in a way that I hope will give some intuition about the relationship between the quantity being estimated (for us, \(p\), the proportion ofthe Earth’s surface that is water), the observed measurements (\(W\) and \(L\), the counts of “water” and “land”), and the number of measurements we take.
To do this, we’re going to use a Bayesian statistical approach, rather than kinds of approaches you might be more used to (t-tests, ANOVA, linear regression, and the like)1.
7.1 A Bayesian approach
Bayesian Inference in scientific data analysis can be quite simple.
Bayesian data analysis can be accounted for in two sentences:
- For each possible explanation of the sample, count all the ways the sample could happen.
- Explanations with more ways to produce the sample are more plausible
The meaning of this may not be clear at first, but we will work through our data to get an intuition about it.
Firstly, let’s rephrase the description of Bayesian data analysis above, to be specific to our experiment:
- For each possible proportion of water on the globe, count all the ways the observed sample of tosses could happen.
- Proportions with more ways to produce the sample are more plausible.
7.1.1 What planets are possible?
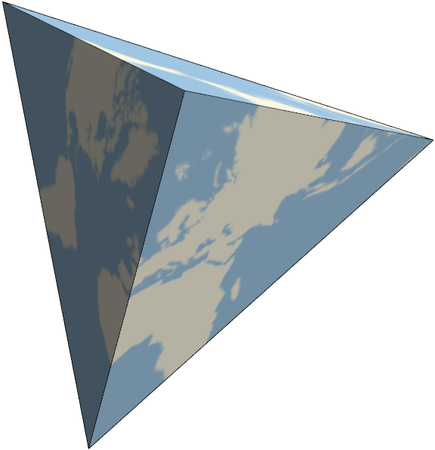
There are a lot of possible proportions of water on the globe, between 0 (all land) and 1 (all water). In fact there are an infinite number of possible proportions! But that’s a bit much to start with, so let’s build up from a set of smaller possibilities. We’ll begin by pretending that the Earth is a tetrahedron (Figure 7.1)2.
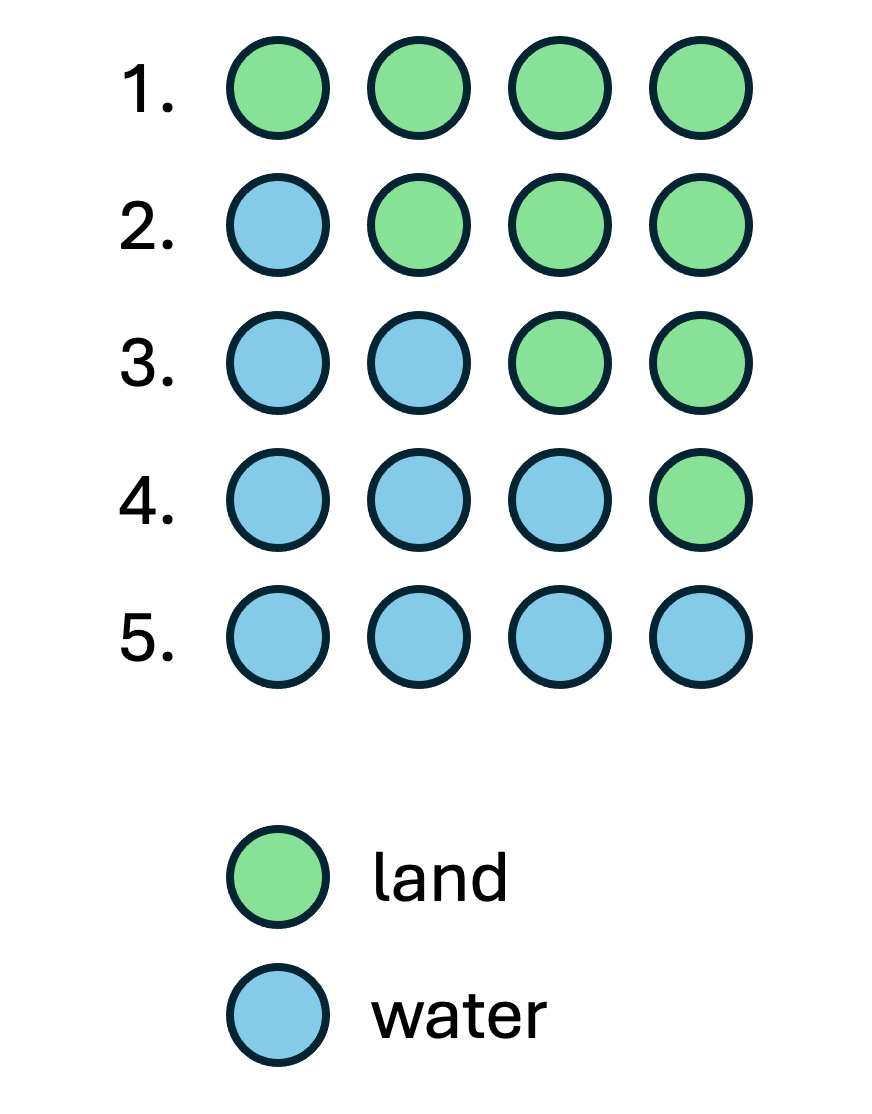
We’ll also pretend that each face of this Tetrahedron Earth can either be water or land. So there are five possibilities in total:
- All four faces are land (0% water)
- Three faces are land, one is water (25% water)
- Two faces are land, two are water (50% water)
- One face is land, three are water (75% water)
- All four faces are water (100% water)
and we represent these in Figure 7.2.
7.1.2 The most plausible planet (small sample)
Now suppose that we’ve made the first three observations in our sampling from Chapter 5: L, W, L (Figure 7.3), for two “land” (L) and one “water” (W). We want to calculate how many ways we could have seen this outcome (two L and one W), for each of the possible proportions in Figure 7.2.

L, W, L.
We’ll demonstrate the way the calculation works for a single possibility: where Tetrahedron Earth has a single “water” face, and three “land” faces. Let’s think about each of the observations in turn:
- The first observation is
L. There are three “land” faces, so there are 3 ways this result could have been generated. - The second observation is
W. There is one “water” face, so there is 1 way this result could have been generated, so there are \(3 \times 1 = 3\) ways that the first two results (L,W) could have been generated. - The third observation is
L. There are three “land” faces, so there are 3 ways this result could have been generated. This means that there are \(3 \times 1 \times 3 = 9\) ways that the result sequenceL,W,Lcould have been generated.
We can repeat this kind of counting procedure to identify the number of ways the outcome L, W, L could have been produced, for each of our five possibilities (Figure 7.4). When we do so, the 25% water planet can give rise to the data in the greatest number of ways, so is the most plausible explanation of the data, and we should expect that Tetrahedron Earth** has one “water” face, and three “land” faces**.
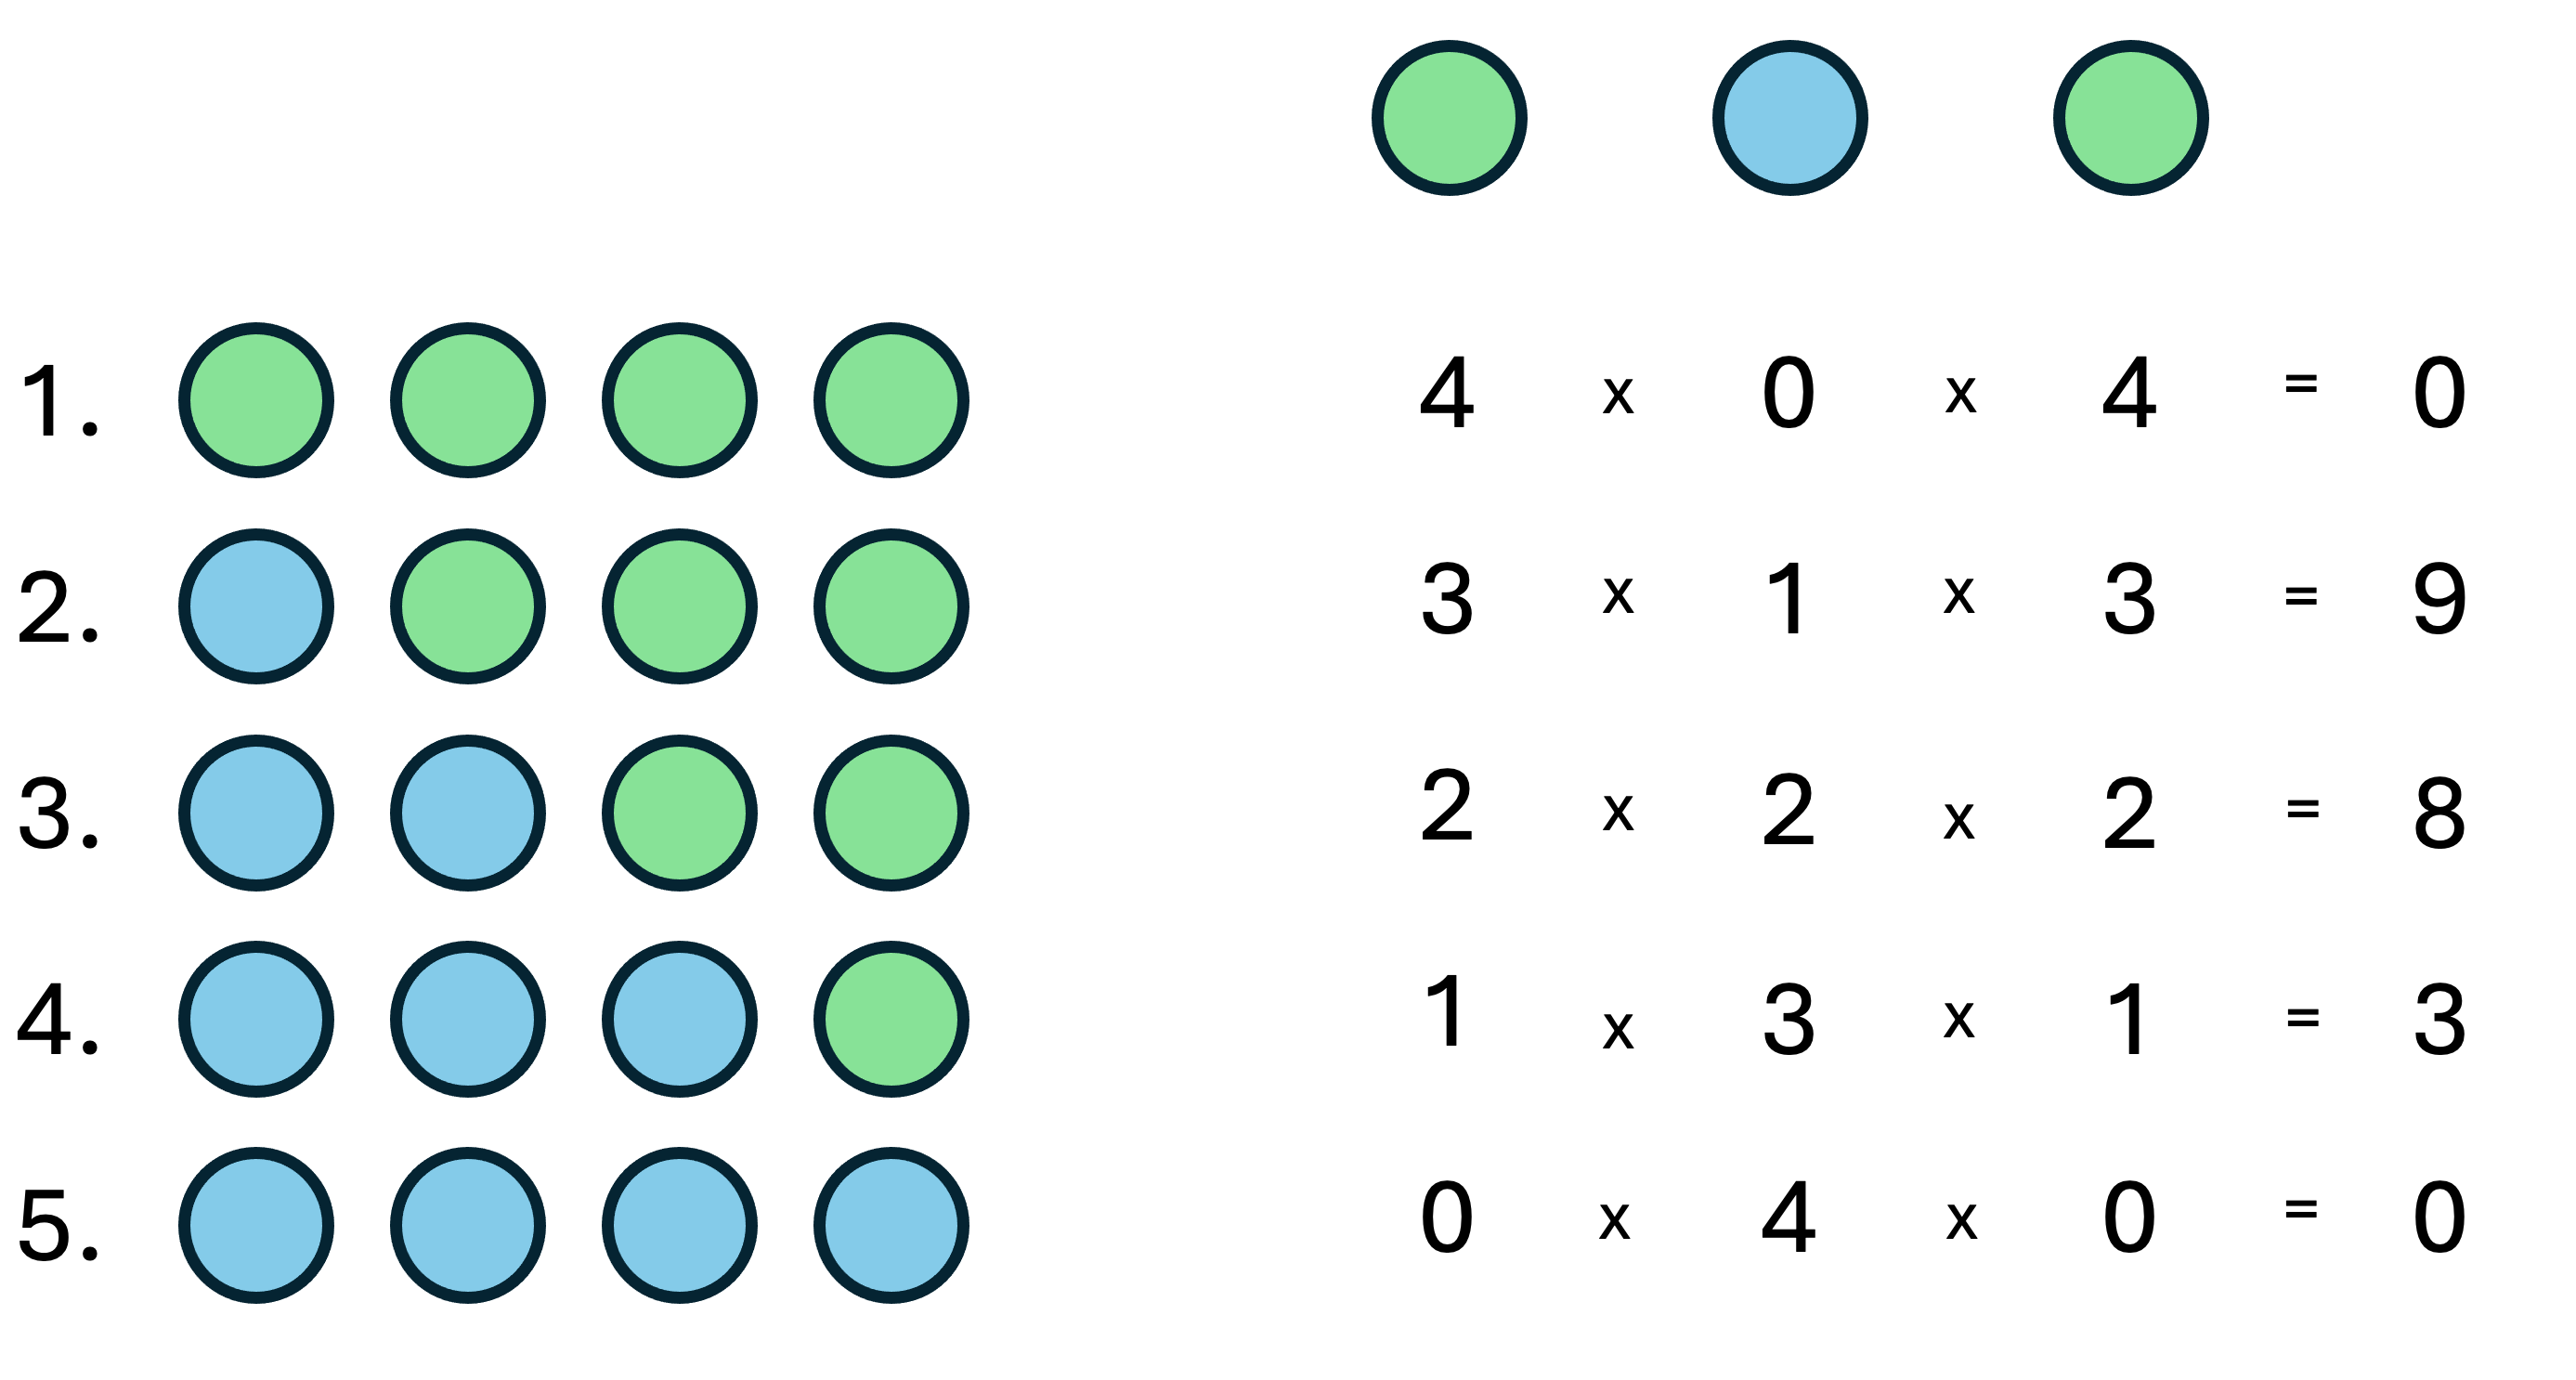
L, W, L for each of the five possibilities of Tetrahedron Earth. There are no ways that an “all-water” or “all-land” Earth could produce this outcome: they are completely inconsistent with the evidence. The 25% water possibility can give rise to the observations in nine ways; the 50% water planet in eight ways; and the 75% water planet in 3 ways. The 25% water planet can give rise to the observations in the greatest number of ways, so is the most plausible explanation of the data.
Although we have identified the most likely possibility for Tetrahedron Earth as 25% water because this configuration can generate the data in the greatest number of ways, this is not the whole story.
What really matters is not the largest count, but the relative sizes of the counts. Right now, the 25% water and 50% water planet options have very similar counts. This is due to the small sample size, so there’s not a lot of evidence about which of the two options is most likely.
This is a good feature of statistical analysis. We don’t want our analysis to be overconfident with small samples.
7.2 The most plausible planet (whole sample)
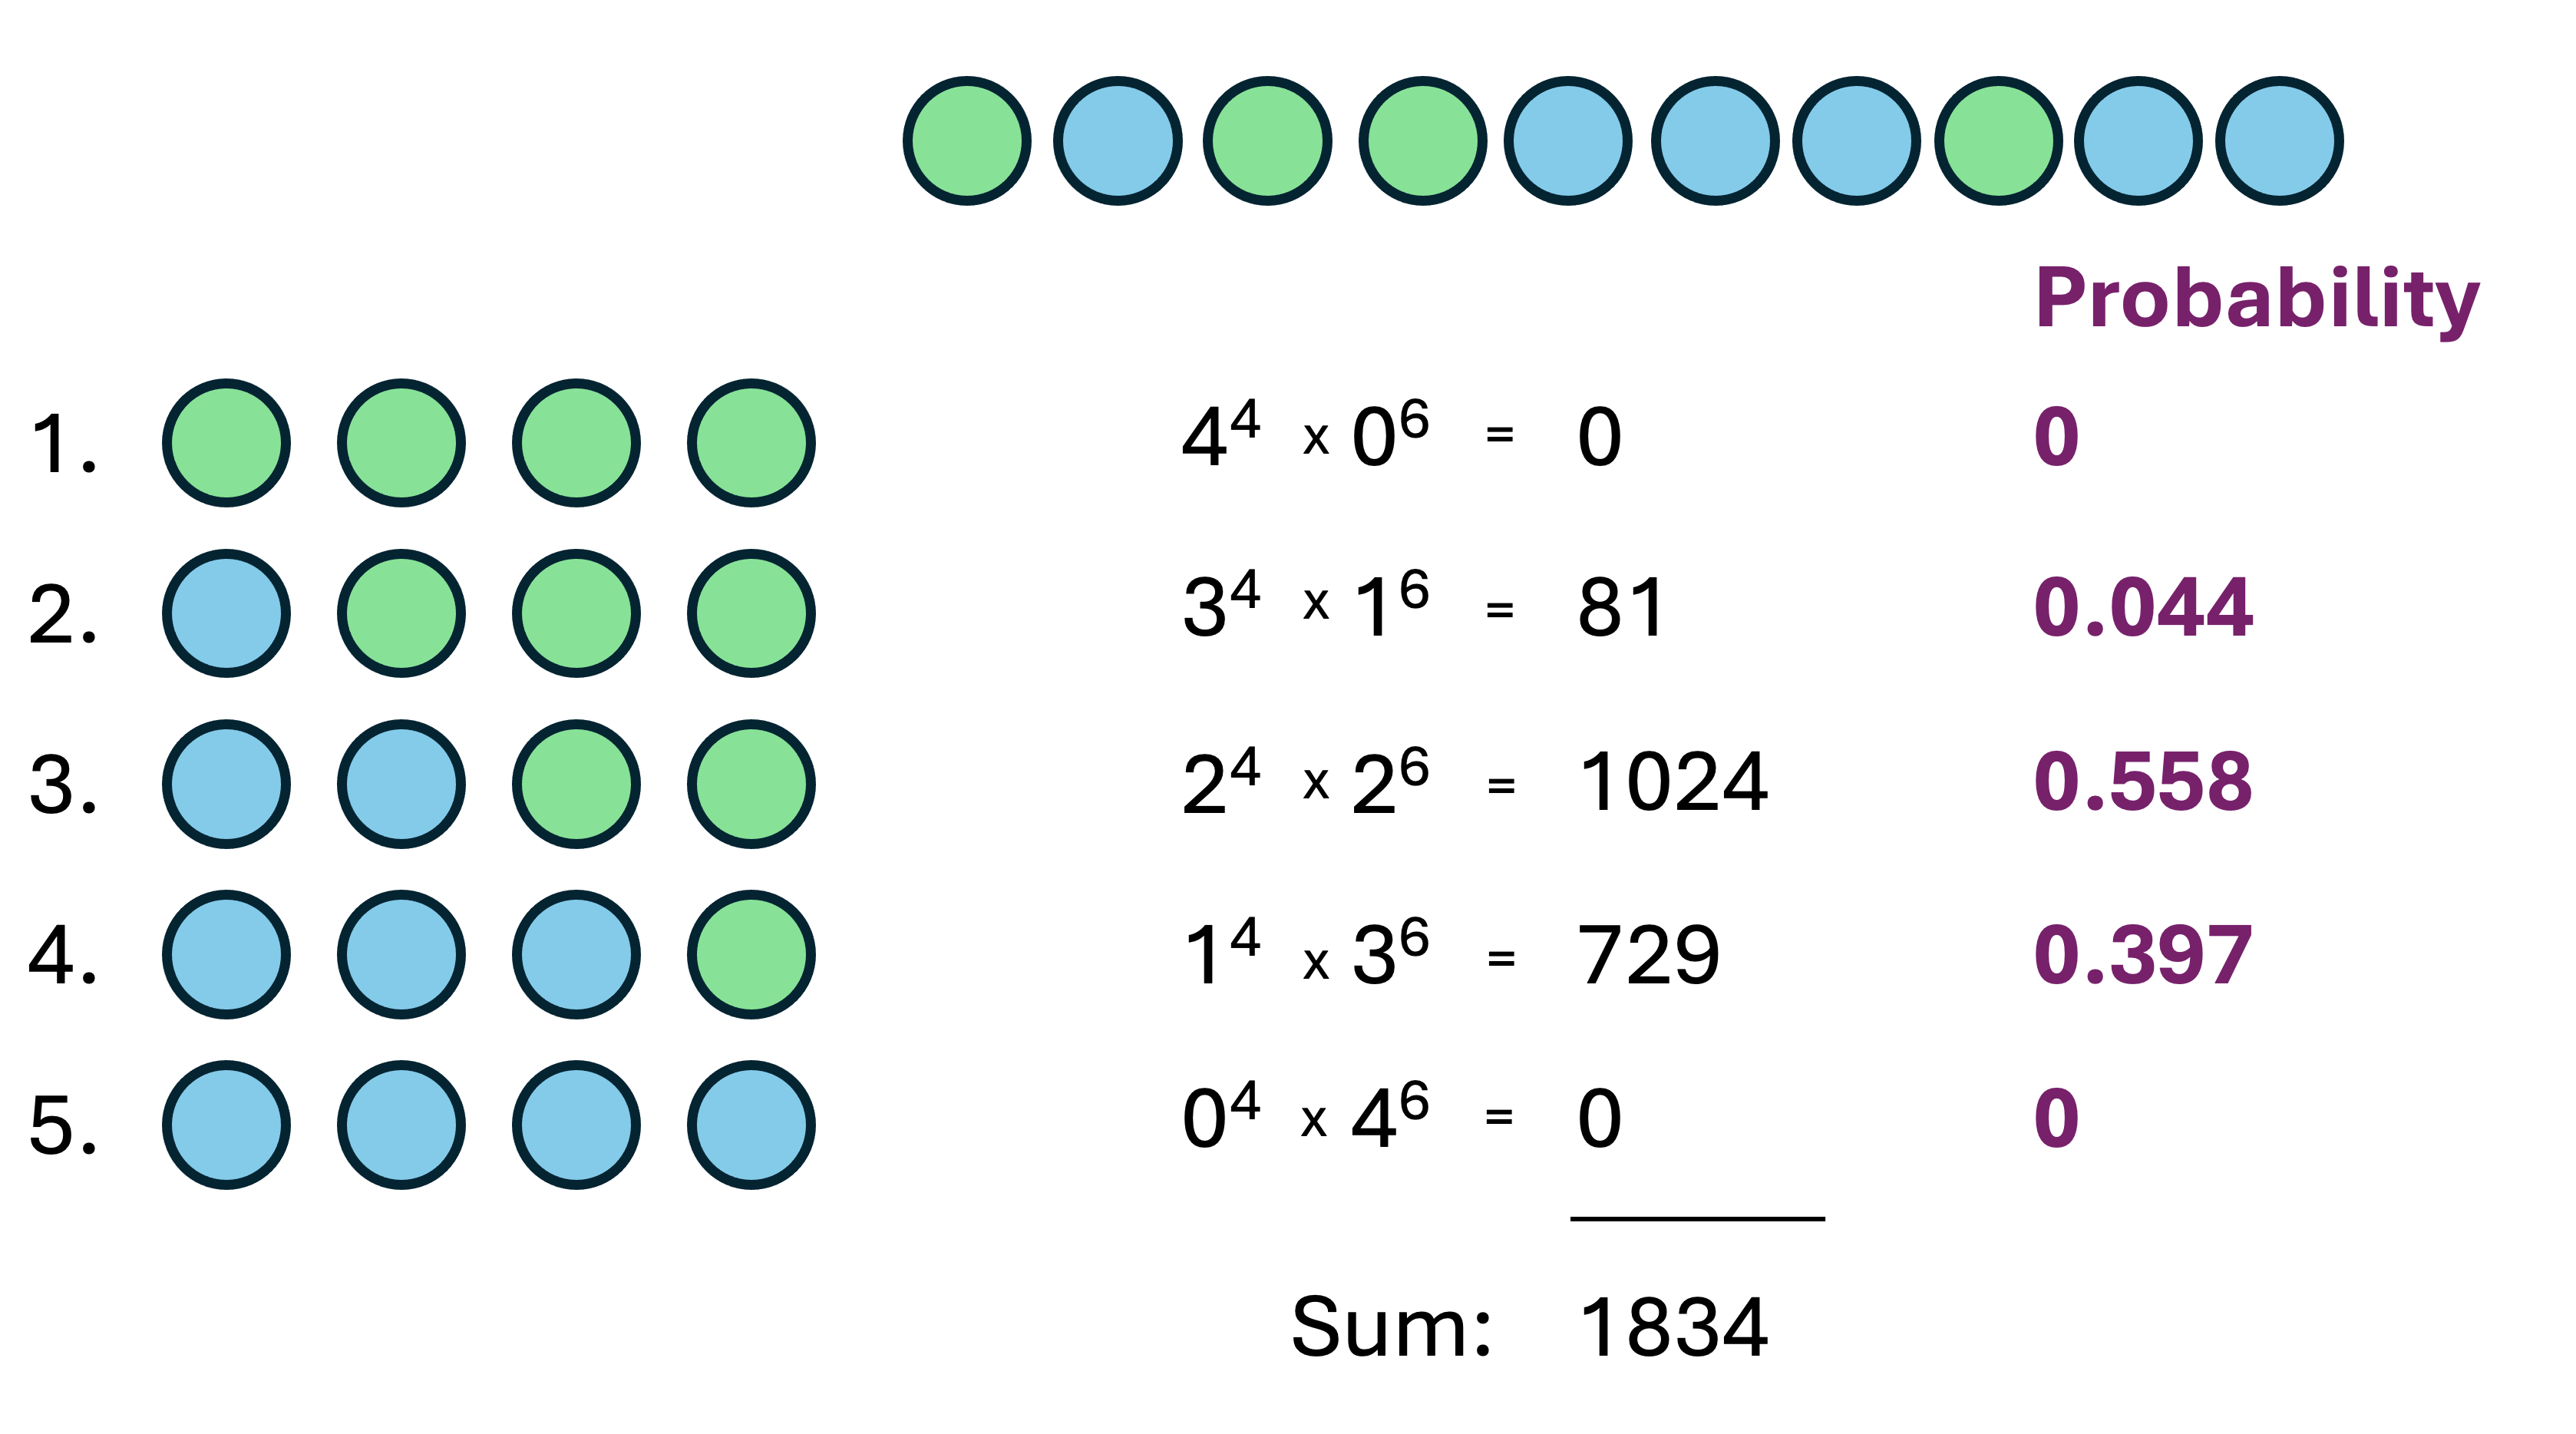
Let’s consider our full set of ten observations: L W L L W W W L W W. We can repeat the analysis above, to see what difference having more data makes to the plausibility of each possible Tetrahedron Earth (Figure 7.5)
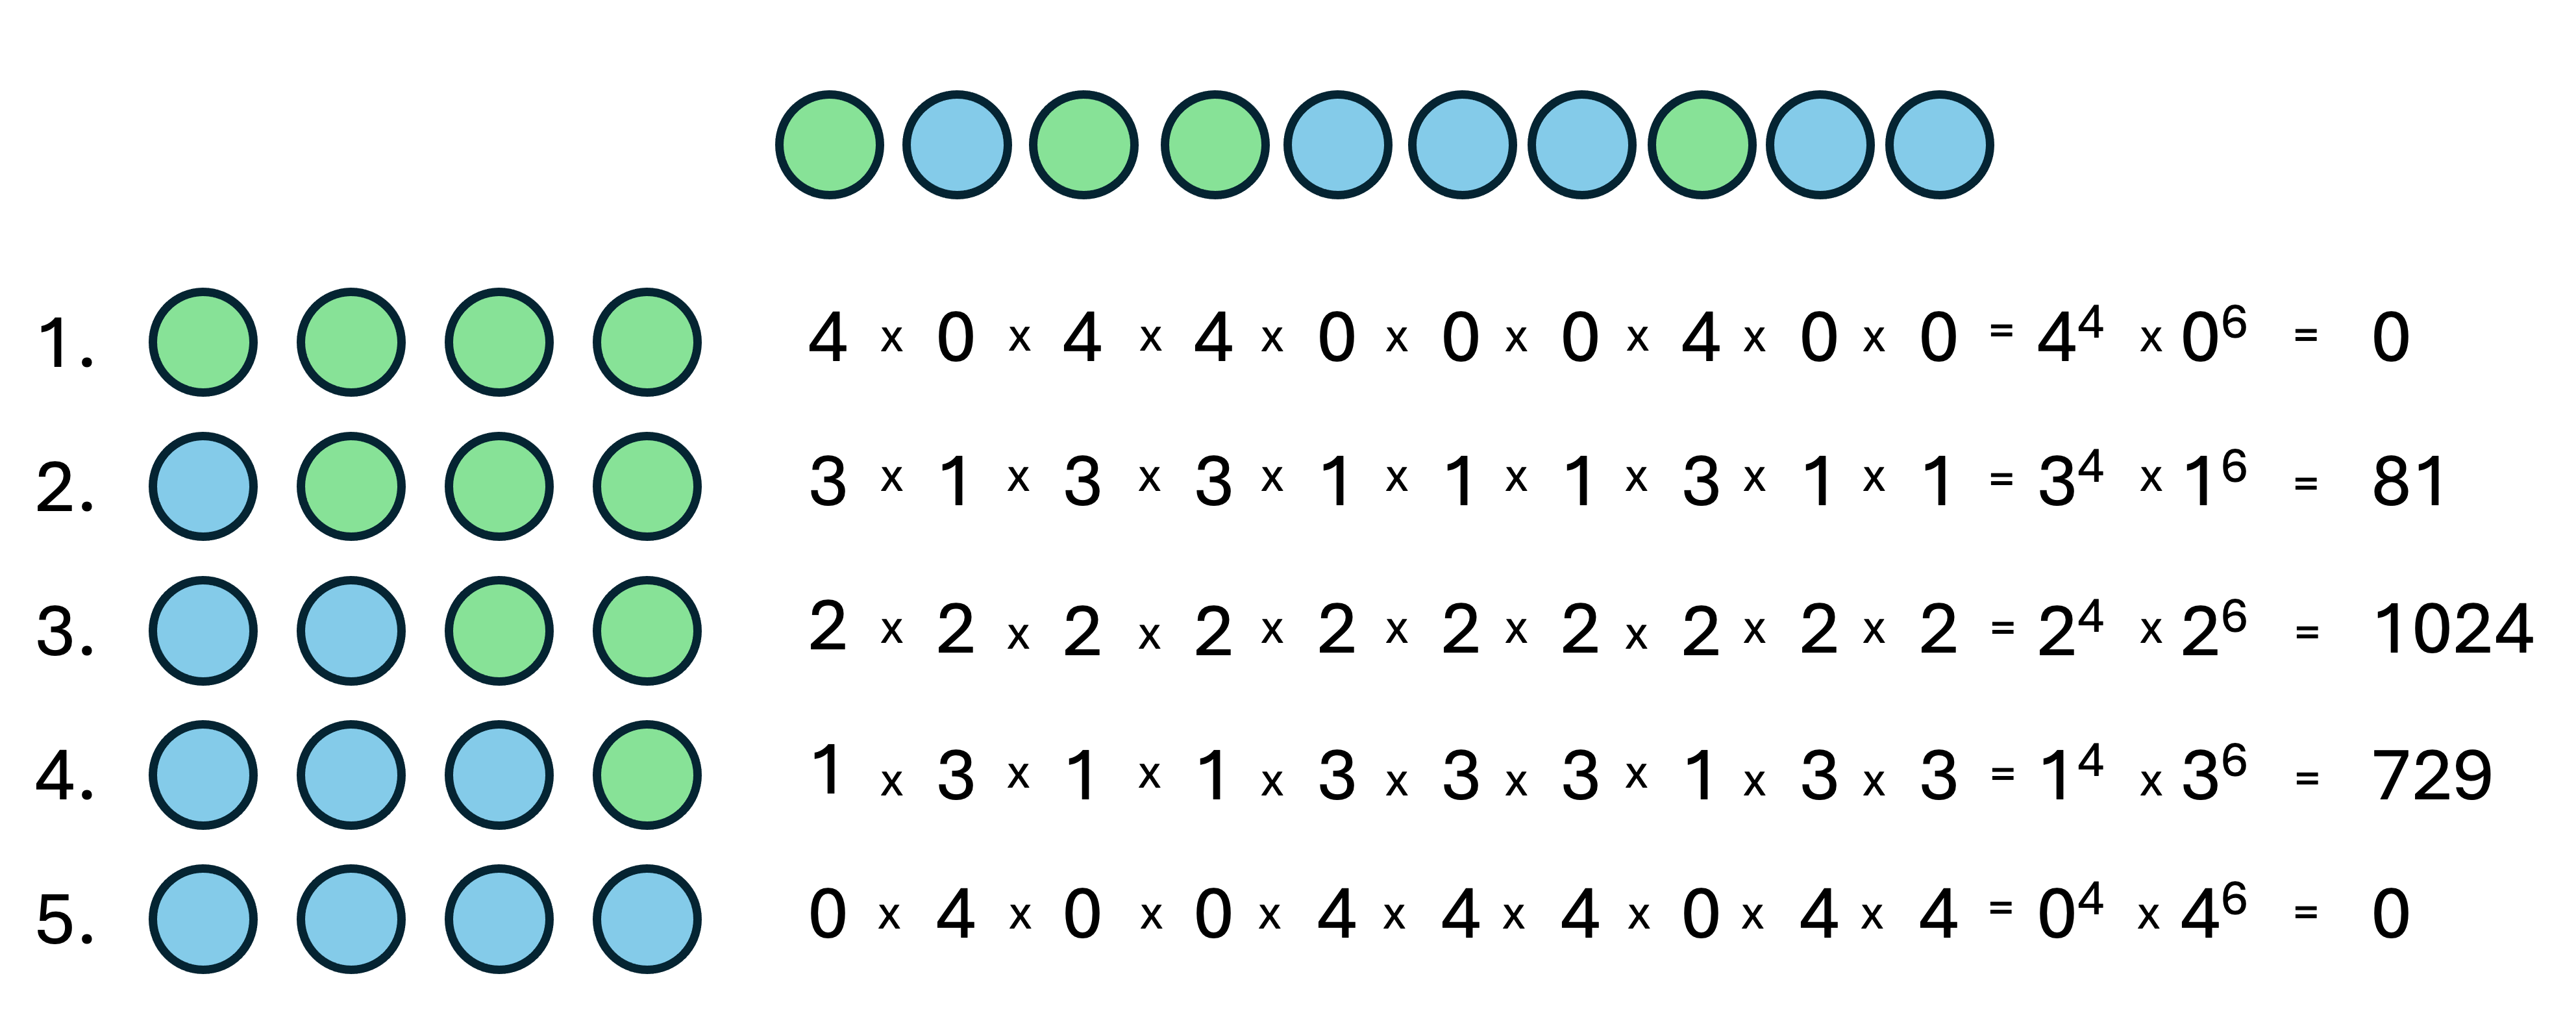
We now have a different most plausible planet. The 50% water version of Tetrahedron Earth can generate the sample in 1024 ways, far more than the 25% water planet. With 81 ways of generating the sample, the 25% water planet lags a long way behind the 75% water planet. But the relative counts for 50% water and 75% water are still quite similar (1024 and 729), so there is possibly not enough evidence here to be decisive about which is most plausible.
There is still uncertainty in our assessment of the most plausible planet.
7.3 The most probable planet
In Statistics we tend to deal with probabilities, and it is useful and usual to convert our evaluation of the most plausible explanations from Figure 7.5 into probabilities, as in Figure 7.6.
The probability of an outcome is the proportion of all relevant events that we would expect to have that outcome. For example, a fair coin has two sides: Heads and Tails. There are two possible outcomes, and “Heads” is one of them, so we would expect the outcome “Heads” to occur about \(\frac{1}{2} = 0.5 = 50\%\) of the time. In exactly the same way, we simply take the sum of ways our sample can be produced (which is 1834) and, for each possible planet, divide the number of ways it could generate the sample by that total.
Another reason for working with probabilities is that the number of ways we can produce large samples becomes enormous and unwieldy to calculate with. Working with probabilities keeps the work manageable on a computer.
Having calculated probabilities for the most likely configuration of Tetrahedron Earth, given the data we collected, it appears that there’s a 56% probability that it has two water faces, and 40% probability that it has three water faces.
We are still working with a small sample size, and these two outcomes have similar probabilities.