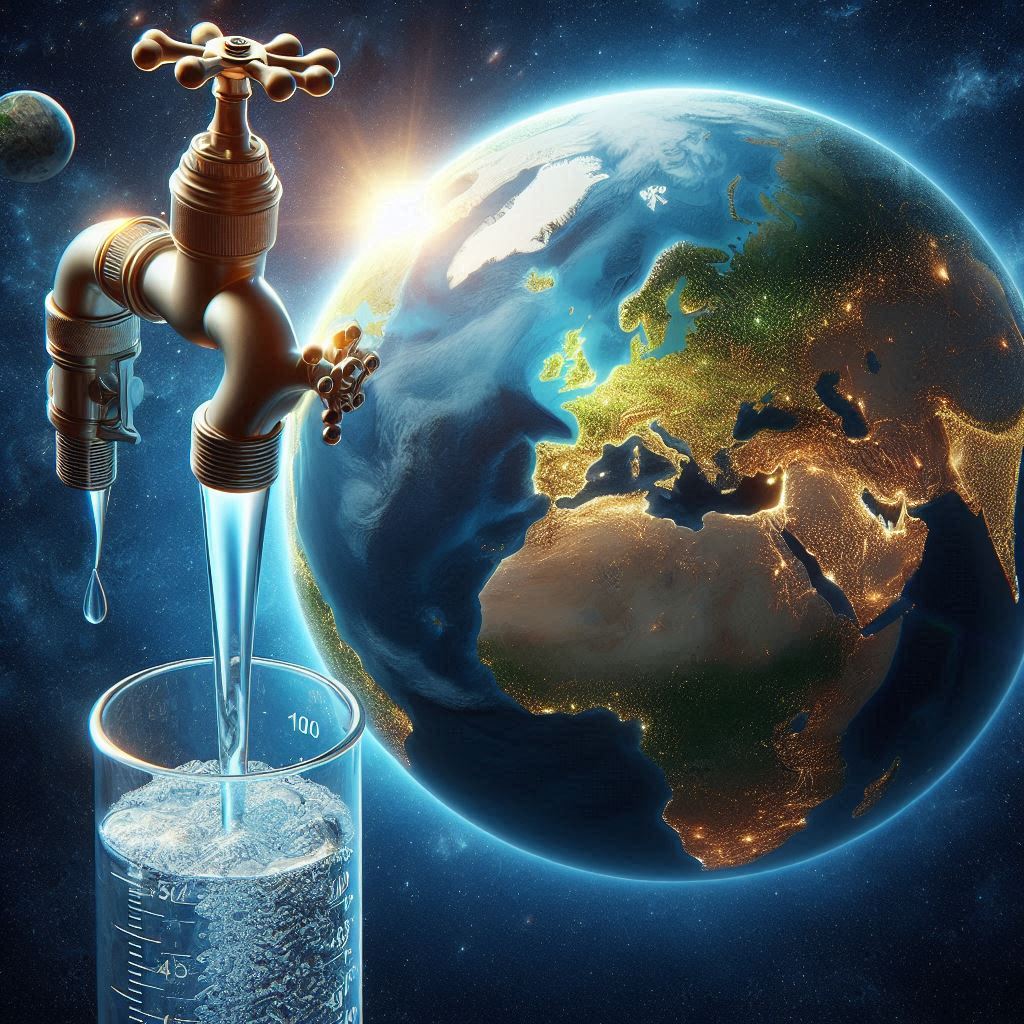
5 How Wet Is The Earth?
5.1 Measuring something that can’t practically be measured
Suppose you want to measure the proportion of the Earth’s surface that is water. How would you go about it, practically? Maybe you could…
- pour the water off into a large measuring cylinder.
- (But there isn’t a container big enough)
- take some time out of your studies and walk around the globe with a tape measure to find the cumulative distance around the edge of all the oceans, then calculate the area.
- (But you can’t measure the length of a coastline. Due to the Coastline Paradox, coastlines have no well-defined length)

So, if we can’t find a way to absolutely, precisely measure the proportion of the Earth’s surface that is water, we must instead estimate it.
It’s possible to question the practical use of this experiment, but the situation is not really that far removed from making any experimental measurement.
There may be a value of something in the “real world” you’d like to measure accurately, like the concentration of a glucose in a patient’s blood. But how exact can your measurement really be?
- Is the concentration of glucose uniform throughout the bloodstream?
- Is the small amount of sample you take representative of the entire bloodstream?
- Does the way you process the sample make any change, however small, to the concentration?
- Is the machine you use to measure the concentration accurately calibrated and absolutely precise? Or does it make an estimate?
- Are you considering glucose concentration in one patient, or several patients? How much does variation from patient to patient matter?
- If you are measuring acrosss several individuals, then how representative of the total population was your choice of individuals?
There are many influences on experimental measurements that can mean they are, in fact, estimates, rather than the true value we hope to measure.
The questions above, particularly those concerning whether the sample you take, or the individuals you sample from, are truly representative of a greater whole, imply something important that we will deal with shortly:
You cannot avoid (statistical) modelling.
The way that you assume your small blood sample represents the full bloodstream is a model. The way that you assume your small group of experimental subjects represents a larger population of possible similar experimental subjects is a model.
If you are using animal models of human biology, the clue is in the name: your assumptions of how representative they are of humans is a model.
It’s as well that we are always aware and, wherever appropriate, explicit that we are using (statistical) models.
5.2 Making an estimate
Suppose we have a globe that represents the Earth (Figure 5.2). Now if we spin it up in the air and catch it, then look at the spot where our right index finger lands, that finger will either be on land (L) or on water (W).

If we do this many times, we will gradually build up a set of data points that are water (W) or land (L). We can use this dataset to estimate the proportion of the globe that is covered in water.
This might seem a frivolous example, but there are direct analogues of the kinds of experiments you will hopefully go on to perform in your future careers:
- the inflatable globe is a model taking the place of the real “population” we want to make inferences about
- in what ways is the globe a good, or bad, model?
- is any single call of “land” or “water” an estimate or an absolute measurement?
- this process shares a sampling structure, and an inferential structure, with many scientific problems
- what other scientific questions might be answered in a similar way?
So, let’s throw the inflatable globe up in the air ten times, and see where our finger lands (Figure 5.3). This will be our dataset.
5.3 An experimental result
Our intial dataset for estimating how much of the globe is covered in water is:
L W L L W W W L W W
Four lands (L) and six waters (W)
We might naïvely decide that, because we have six waters (W) and four lands (L), our dataset implies an estimate of the proportion of the Earth’s surface that is water of 60% (there are six waters, and ten measurements). But in the next chpater, we’re going to consider this experiment in a bit more detail1, and see how our prior expectations, and the number of measurements we make, relate to the precision of our estimate, and our beliefs about the uncertainty in the measurement.
And also in the context of Bayesian Statistics↩︎