15 The Workshop Experiment
In this workshop we are going to build an EDA diagram from scratch to represent a simple experiment with the aim to test for the effect of novel drug on glucose levels in the plasma of diabetic mice.
15.1 The experimental description
We can describe our experiment in the usual way we’d approach writing a grant application (or, in the past tense, a Methods section) as something like:
We will use NONcNZO10/LtJ mice (JAX) to represent a polygenic form of diabetes. Mice in the treatment group will receive a single subcutaneous injection of drug A (up to 30mg/kg). Mice in the control group will receive a single subcutaneous injection of vehicle. Mice will be randomly assigned to receive either drug A or vehicle only without regard to the sex of the animal. 48 hours after administration of drug or vehicle, the blood glucose level will be measured.
This is a concise and accurate description of the experiment but, as is good practice, we will begin by laying out what we understand about the experiment that is relevant to the design.
- We are testing the effect of a new drug - drug A - on plasma glucose levels
- There is a single experimental variable of interest: whether drug A is present (treatment) or absent (control)
- The plasma glucose level is our outcome measure
- Our experimental subjects are diabetic (NONcNZO10/LtJ) mice
- We will divide individuals into two groups, by different pharmacological treatment
- Group 1 will receive the vehicle with no active drug (the control)
- Group 2 will receive the vehicle, containing active drug (the treatment)
- Individuals will be allocated to each group randomly, by complete randomisation
- We are not testing for the effect of sex on drug performance as an experimental variable of interest
- We are also not monitoring for the effect of sex on drug performance as a nuisance factor
It seems like we understand what we want to study, and how to control for outside influences that aren’t of direct interest, so this is enough information to begin constructing an EDA diagram describing the experiment.
15.2 Causal relationships in our experiment
For the experiment we are building in our EDA example, we assume that the outcome variable, plasma glucose level, is potentially dependent on three causal relationships:
- the pharmacological effect of drug A
- the pharmacological effect of the vehicle
- individual differences between experimental subjects (mice)
and we have structured our experiment accordingly:
15.2.1 The pharmacological effect of drug A: treatment vs no treatment
The causal influence of administering drug A (or not) on the plasma glucose levels of our experimental subjects is the central reason for performing this experiment. Naturally then, we would want to compare what happens to plasma glucose levels when we intervene with drug A, and when we do not.
In statistical terms, the presence or absence of drug A is our independent variable or explanatory variable.
Whether drug A is administered or not is entirely under our control, as experimenters.
There are several ways to structure such a comparison, but this research question naturally suggests the use of two experimental groups: one receiving drug A, and one not. We can assume that the results for these groups are each representative of a much larger population, for which the effect of introducing drug A (or not) follows the shape of a parametrisable statistical distribution, like a Normal distribution.
15.2.2 Control vs treatment groups
Unfortunately, we cannot administer the drug in isolation. Drug A, like most drugs, is carried in a vehicle - a substance expected to be inert in the context of the treatment.
It would be possible, but unwise, to assume that we could administer drug A alone to one group of mice, and apply no intervention to the other. We are measuring a physiological response which might be affected by many other processes, including the individual being subject to an injection. It might not be correct to assume that the vehicle is inert, either. So we must follow the same protocol as closely as possible in a control group, where the only difference under our control between control and treatment is the presence or absence of drug A.
Practically then, in our experiment we use two pharmacological interventions:
- injection of a vehicle (control)
- injection of a vehicle containing drug A (treatment)
We assume that any variation between individual vehicle preparations (or the experimental subjects’ responses to them) are effectively “drawn from the same population,” and that both groups experience the same causal influence from the injection process, and the introduction of the vehicle. As a consequence we assume that any observed difference between the groups is the result of either receiving drug A, or not receiving it.
15.2.3 Random assignment of individuals to groups
The remaining potential causal influence we consider - that due to underlying differences between individuals - is accounted for inour experimental design by randomising subjects into experimental groups (treatment and control, see Chapter 18).
This works because we assume that all individuals are “drawn from the same population,” such that each mouse as a random choice from a single pool whose underlying plasma glucose level is distributed according to some kind of regular (potentially parametrisable) statistical distribution. This is usually a reasonable assumption, and implies that the groups are samples from the same larger population, so should have similar properties
The important consequence of this is that we can argue that - before we intervene with the experimental treatments - we should expect the underlying plasma distribution levels of our treatment and control groups to be comparable. Any differences in measured outcome should then be expected to derive only from our experimental interventions and, in particular, only from the presence or absence of drug A.
15.3 The EDA Diagram
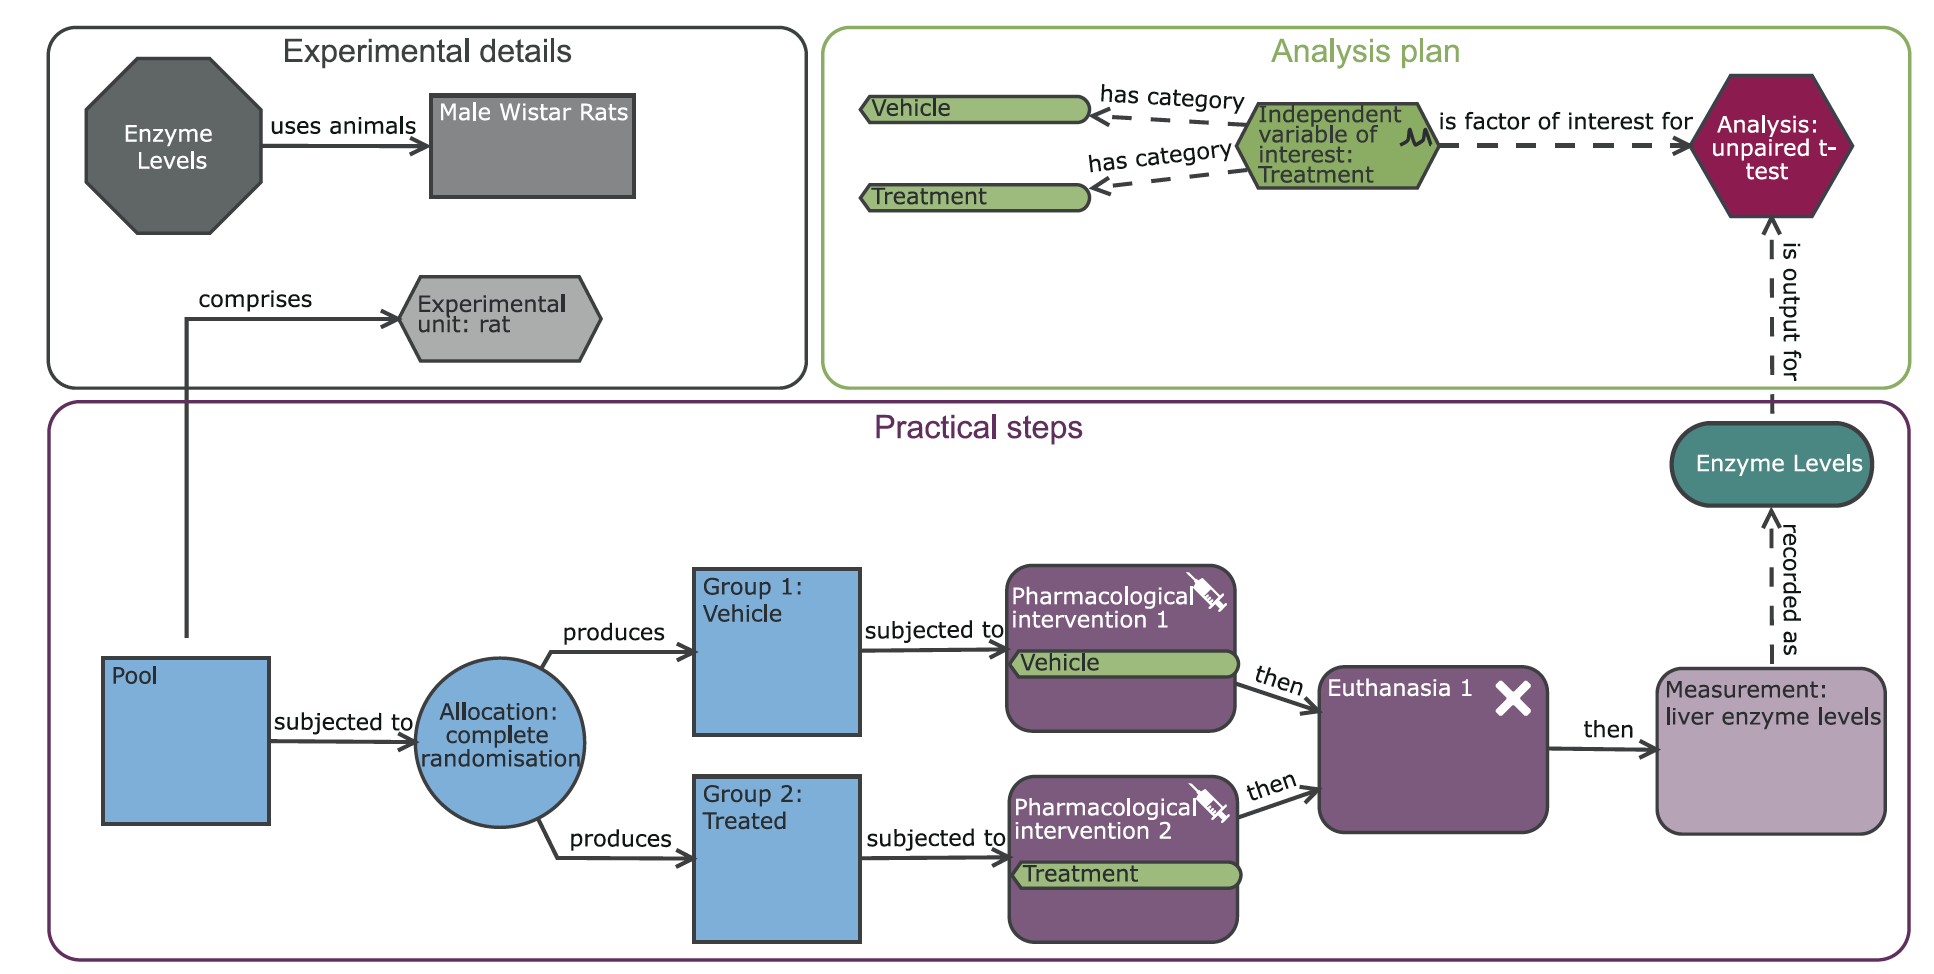
An EDA diagram can be thought of as describing three aspects of an experiment (Figure 15.1)
- experiment detail (grey nodes): Information about the experimental units and subjects, such as sex and genotype
- practical steps (blue and purple nodes): actions that will be taken during the experiment, including pooling and experimental group allocation, surgical or pharmaceutical interventions, and outcome measurements
- the analysis plan (green and red nodes): components of a statistical analysis (i.e. explanatory, independent, and nuisance variables, and covariates), and the analysis itself

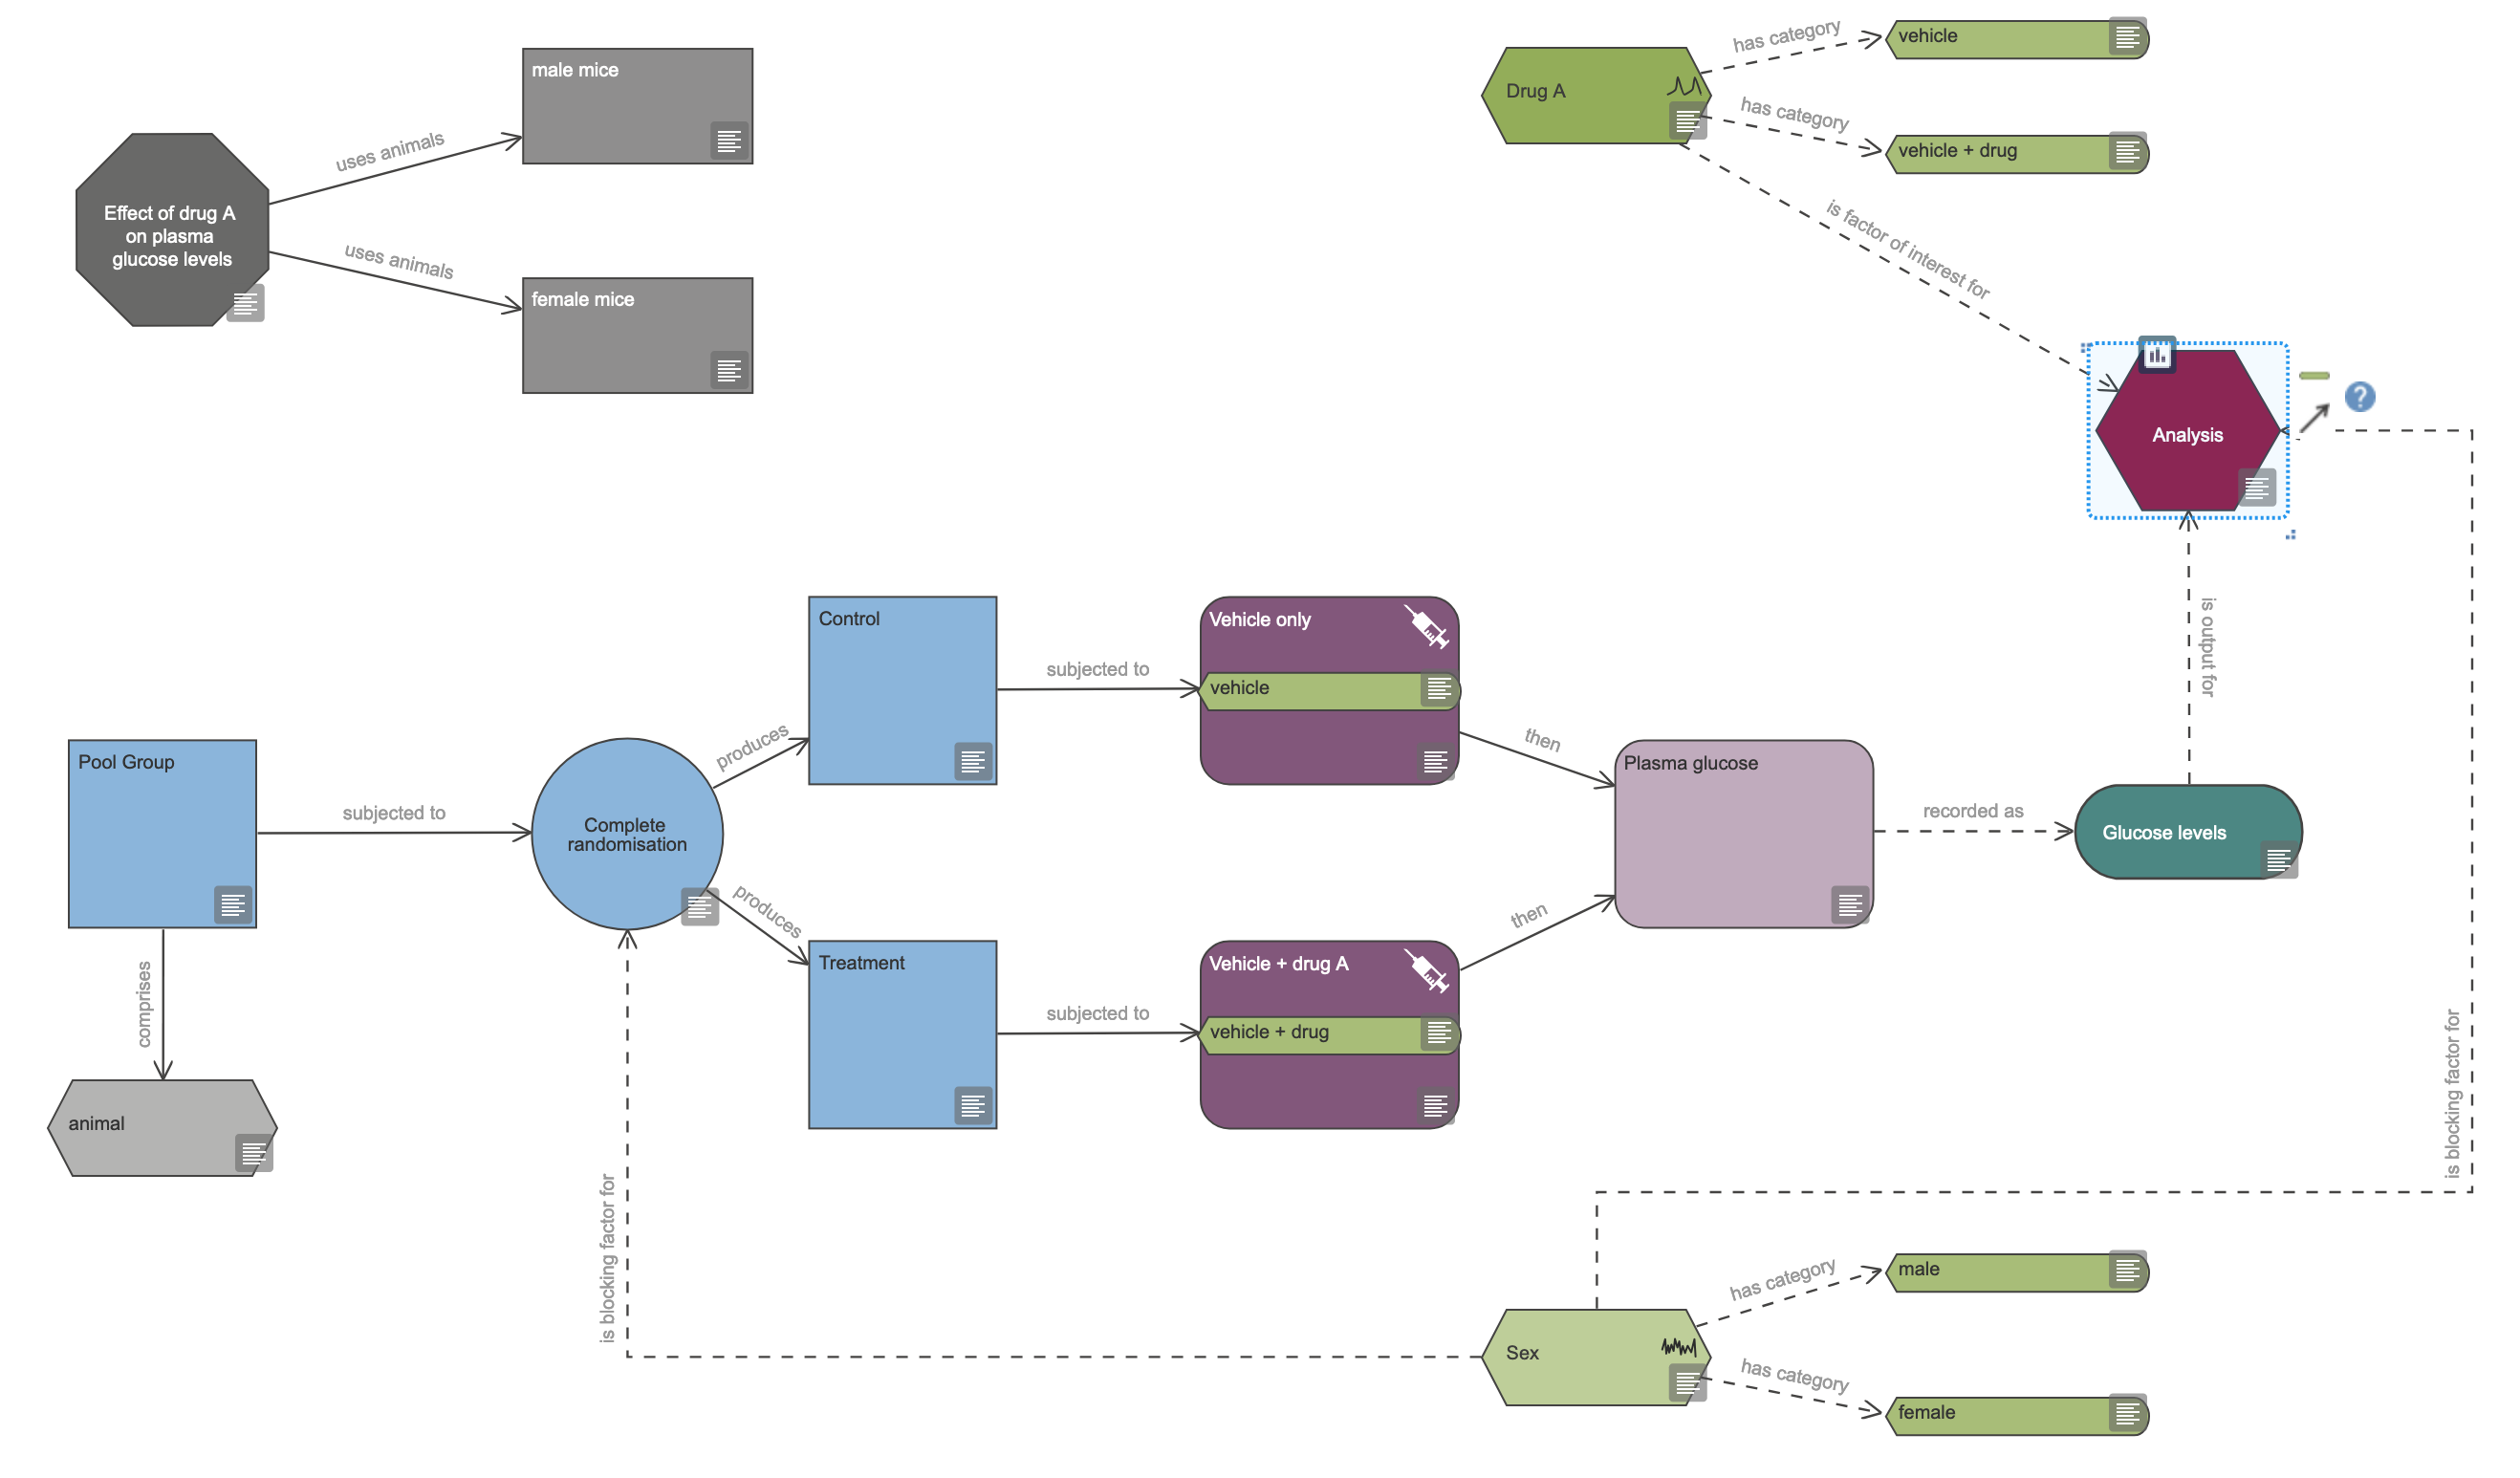
When we have finished our design for the experiment in this workshop, the resulting diagram will look like that in Figure 22.5.

We will use this diagram to get some feedback from the EDA about improvements to the design, and our choice of statistical methods.